
![]()
Responsive or Reactive?
A distinction with a difference: Responsiveness is mindful action whereas reactive behavior is driven by natural instincts.
To counter the market downdraft in 4Q18, Fed Chairman Jerome Powell, on January 4, 2019, declared that the Federal Reserve would be “patient” and “data-dependent” in deciding the future direction of monetary policy. Having just presided over the December meeting at which the FOMC1 raised interest rates by 25 bps, Powell seems to have suddenly decided to end the “normalization”2 process that included raising short term rates five times since December 2017 and reducing the size of the Federal Reserve Bank’s balance sheet concurrent with the improvement in the Financial Conditions Index.4
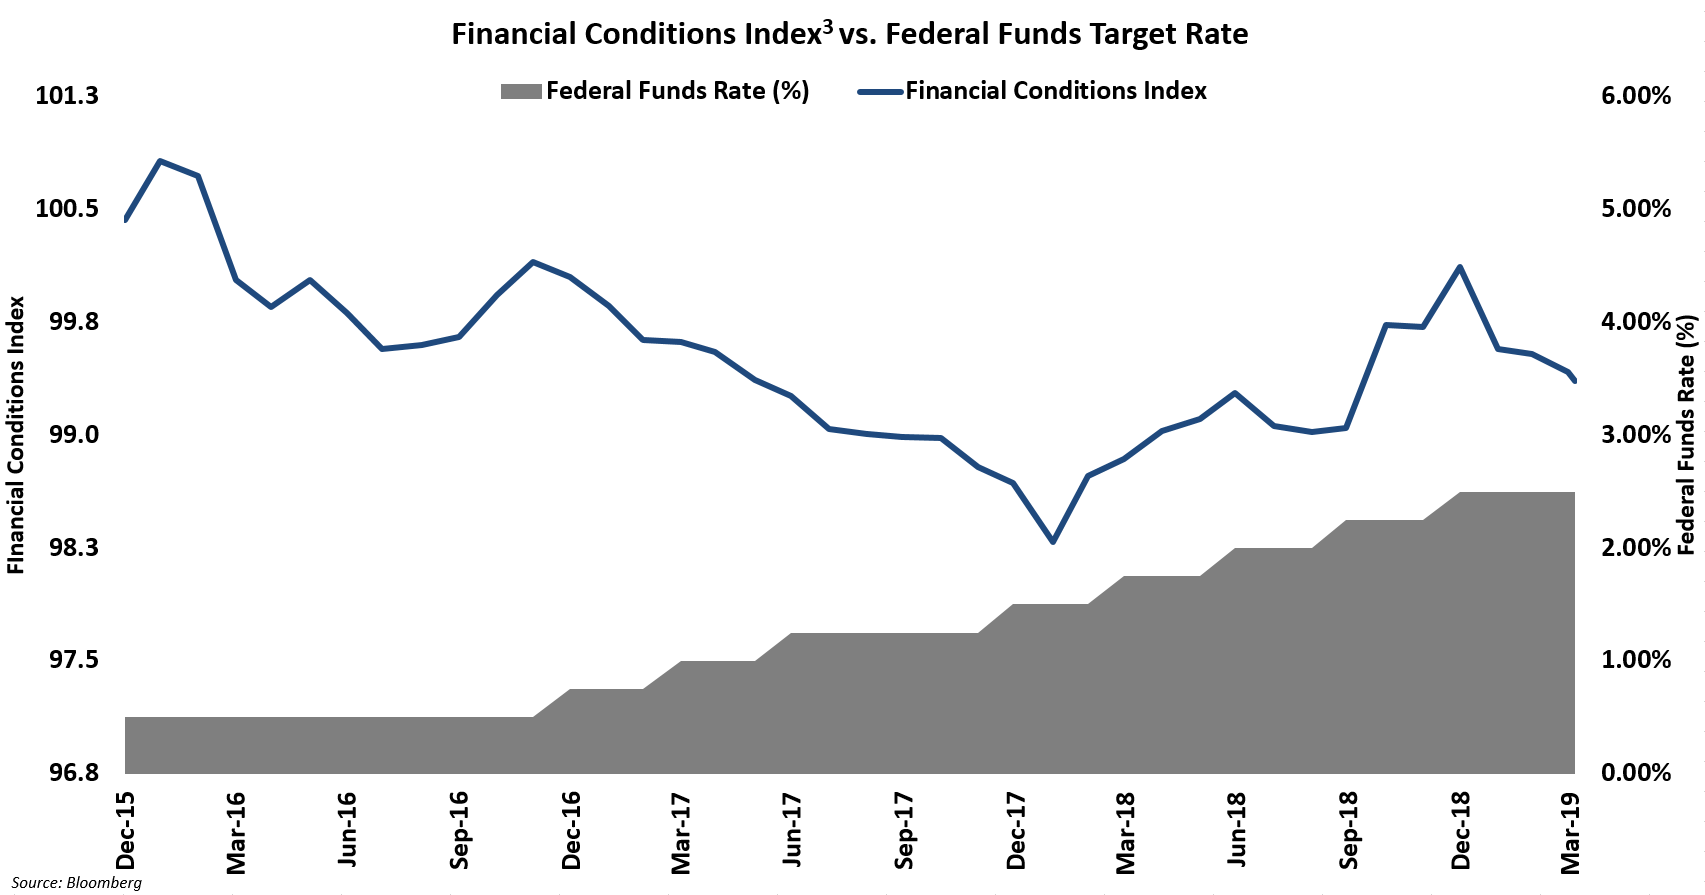
Was this a thoughtful response to economic data that surfaced after the Fed’s December 2018 meeting or a reaction to Mr. Market? Regardless, the markets melted up as the S&P 500 Stock Index experienced the strongest first quarter of the year since 1998 and the High Yield market5 had its fifth best quarter since 1987.
It remains to be seen whether the pause in Fed policy will prolong the expansion that is nearly 10 years long or is a precursor to an inevitable end to this cycle. In a November 2018 research report6, Morgan Stanley made the case that we are moving from “late cycle” to “end-of-cycle”. Acknowledging that credit cycles always have their own distinct characteristics, they outlined a series of steps that typically play out:
- Inflation pressures build, the Fed progresses in its rate hike cycle (to combat inflation), and credit flows begin to weaken, in part as higher rates mitigate (fixed income investors’) need to reach for yield.
- Financial conditions begin tightening, volatility rises, and (credit) spreads drift wider after hitting cycle tights, all while the economy remains strong.
- Idiosyncratic problems pop up more frequently as tighter liquidity conditions start to break the weak links. The excesses that built up in the bull market slowly start to expose themselves.
- Economic data begin to decelerate and growth expectations turn lower, slowly at first and then eventually much faster.
- Market sentiment turns more sharply as end-of-cycle fears rise, credit conditions tighten quickly, spreads gap wider.
- Companies retrench as earnings decline and the most levered credits lose access to capital – the credit cycle feeds into the business cycle.
- Defaults and downgrades follow, peaking often after the point when spreads have already peaked.
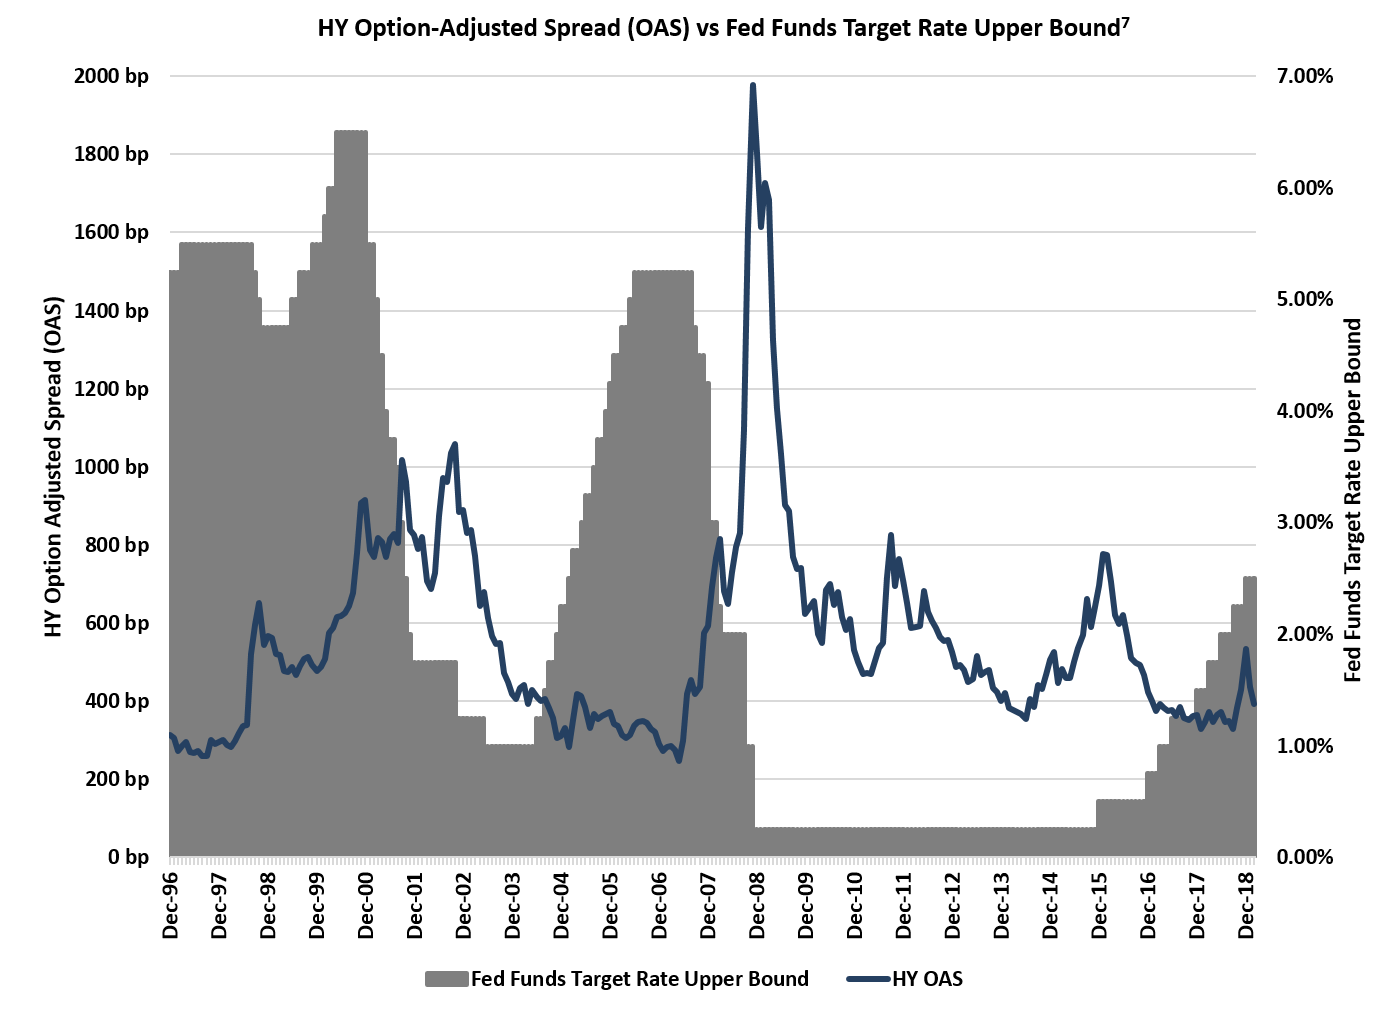
Although the Fed’s decision to stop raising rates, as was the case in 1997-8, mid-2000, 2006-7 and early 2016, usually leads to an increase in high yield credit spreads (as investors began to sense a slowing economy), the Fed’s recent decision to pause has initially led to a bond rally and a sharp decline in high yield spreads. Apparently, credit investors took comfort that the Fed was taking steps to avoid a policy mistake that might slow the economy, exhibiting a herding behavior8 that drove credit spreads for the Bank of America Merrill Lynch High Yield Bond Index down by 122 bps. It remains to be seen whether credit spreads reverse course. Notably, at the end of 1Q19 Fed Funds Futures were projecting a probability greater than 50% that the Fed would reduce rates by year-end 20199. With the negative correlation between credit spreads and interest rates proven empirically in a 2018 study10, such an about-face on interest rates would likely put further upward pressure on credit spreads.
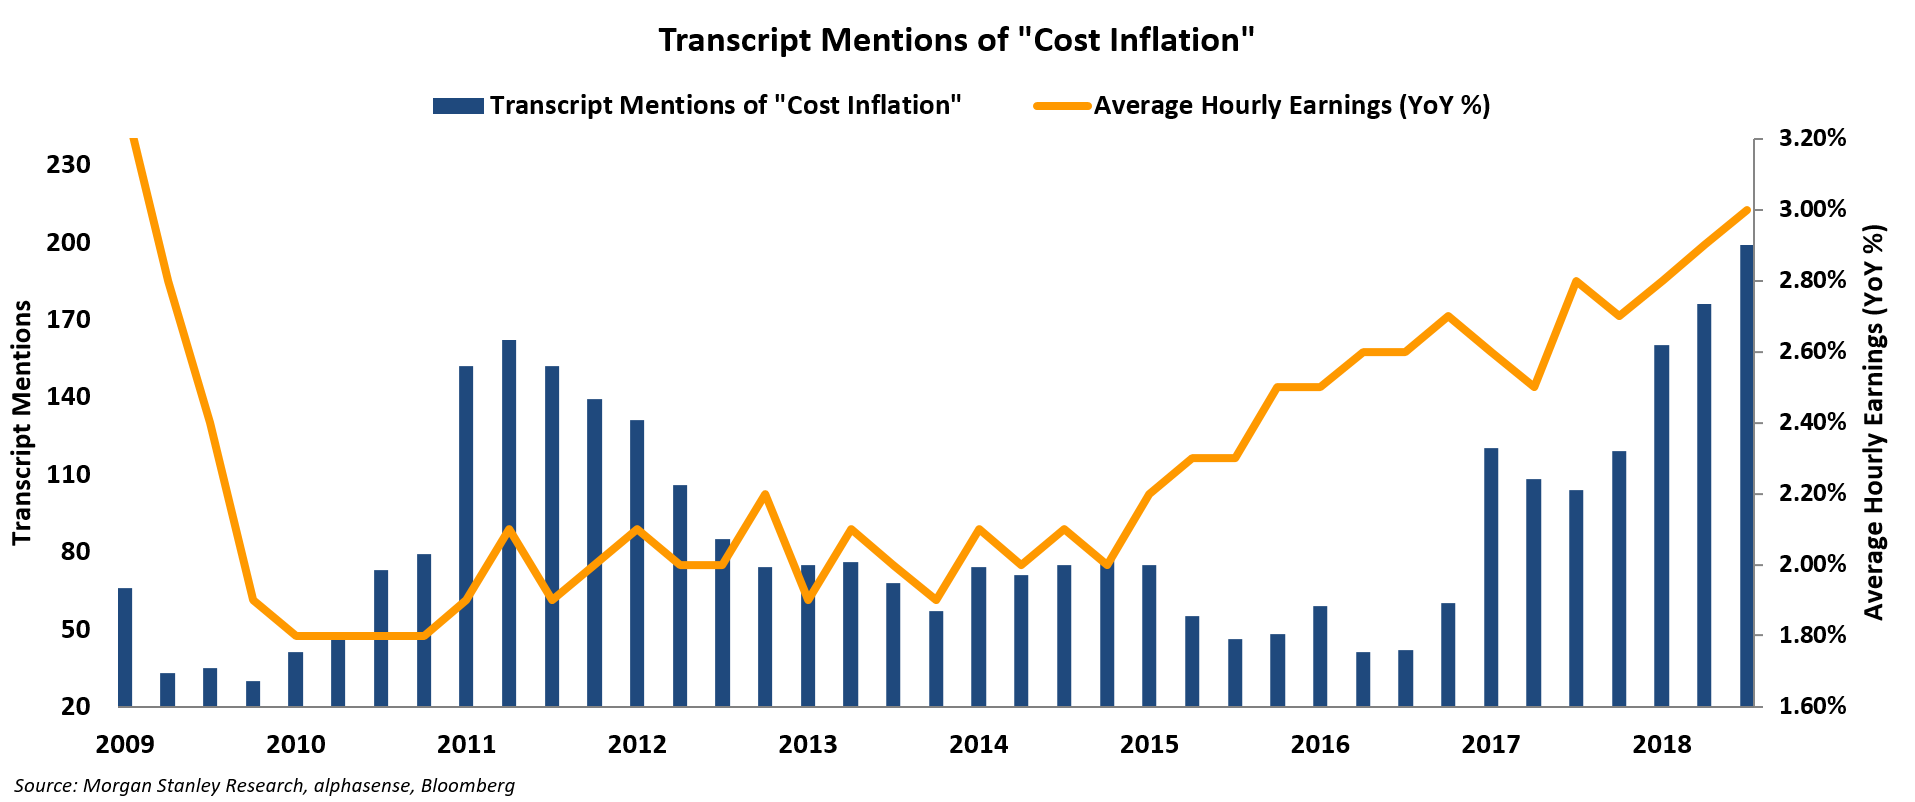
The robust economy of the last two years provided the backdrop for the Fed to raise interest rates. Ideally the Fed wants to contain inflation by tightening monetary policy above the “natural rate”12 without impeding growth and negatively impacting employment. Interestingly, both cost inflation and wages have been on the rise during the Fed’s tightening. Bringing the “punch bowl” back by pausing interest rates, the Fed intended to reassure the markets and reinvigorate growth. Further, resolution of several geopolitical issues (such as trade conflicts, Brexit, strong dollar, etc.), is likely to provide additional stimulus. Consequently, there is a risk that the U.S. economy might begin to overheat, which could cause the Fed to resume hiking interest rates.
Looking ahead, we see two broadly divergent scenarios:
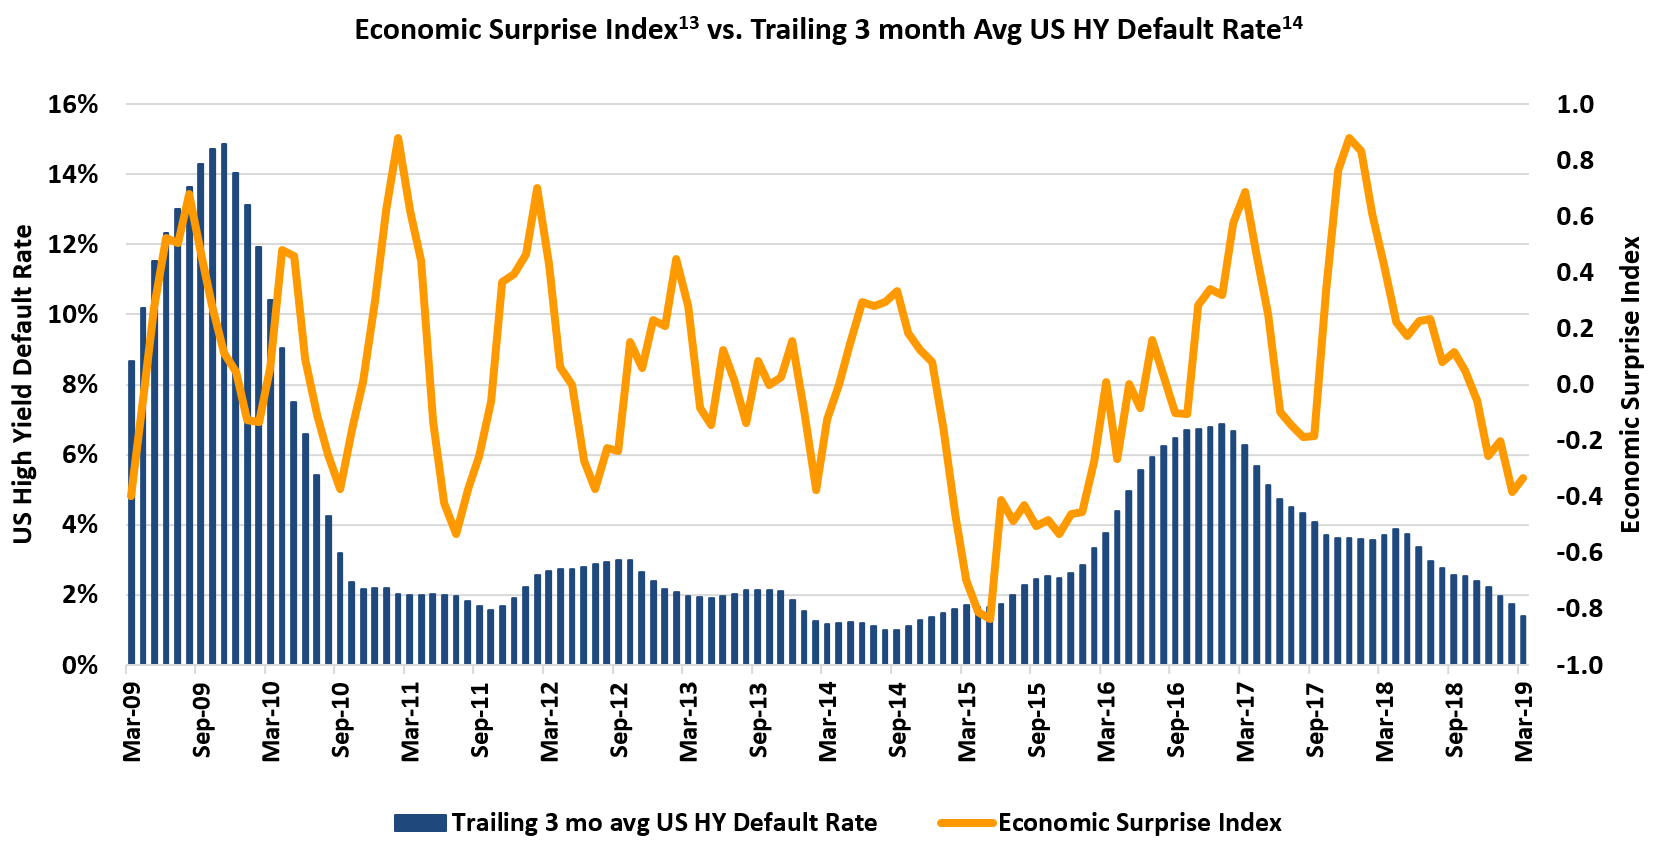
- The Fed begins to lower interest rates in response to weakening economic performance, in which case credit spreads are likely to widen according to historical trends; or
- The Fed will be forced to raise interest rates in response to stronger than expected economic data or in reaction to the market, making it harder for companies to refinance existing debt.
In either scenario, struggling companies with too much debt and/or outdated business models will find it more difficult to “kick the can down the road”. Thus, we expect an increase in defaults and restructurings. The last few years have been benign with respect to credit downgrades and defaults, but there were several distressed situations in 1Q19 that provided the opportunity to invest in DIPs15 and “top of the capital structure” secured loans. We also found opportunities in end-of-life SPACs which repriced to more attractive levels during 4Q18 when investors shifted capital out of that market segment.
Pacific Gas & Electric Company (“PG&E”)16 – PG&E is a provider of electricity transmission and distribution services to its service territories in northern and central California. On January 29, 2019, the company filed for Chapter 11 after it became apparent that it did not have the financial capacity to handle potential liabilities from California’s 2017 Northern Wildfires and 2018 Camp Fire. It sought the protections provide by the bankruptcy process to permit it to raise liquidity to continue operating after credit downgrades cut off access to the capital markets, allowing it time to work through the legislative and regulatory processes with respect to assessment of blame and damages and to consider alternatives to raise funds to compensate victims of the wildfires. With net leverage of approximately 3.6x prior to bankruptcy, we believed that, despite a significant increase in the company’s liabilities related to the fires, the unsecured bonds would be paid in full, with post-petition interest upon the company’s exit from Chapter 11. We began buying several different unsecured bonds, with maturities in the 2025-27 range, prior to the bankruptcy filing. At that time, the yield-to-maturity for these bonds ranged from approximately 6.5% to 7.0%. Given their relatively short-term maturity, however, we expected that, upon exiting Chapter 11, the company would redeem the bonds, resulting in significantly higher rates of return. As investor groups have proposed alternative means to raise capital to deal with the company’s fire-related liabilities, prices for these bonds have risen and yields-to-maturity have narrowed.
Windstream Services LLC17 - On February 15th, 2019 the District Court for the Southern District of New York ruled that Windstream Services, LLC had violated certain covenants associated with a 2015 sale-leaseback transaction of certain fiber transmission lines and hubs related to the spin-off of Uniti Group. This ruling resulted in an Event of Default for Windstream that restricted access to its Revolving Credit Facility. The company promptly filed for Chapter 11 bankruptcy relief on February 24th, 2019 due to a lack of available liquidity necessary for ongoing operations. With Windstream having grown cash flow each year since 2016 and leverage through the secured debt at 2.4x, we were comfortable that the secured debt would achieve a full recovery when the company exited bankruptcy. We began purchasing Windstream’s senior secured debt, the Term Loan B6, at a discount to par which provided a yield-to- maturity of 10.56%.19 As a condition of the DIP financing, the “adequately secured” Term Loan B6 will continue to receive timely cash interest payments with an additional 200 bp increase in coupon. Although the loan price rose to reflect this increase in coupon, later purchases still afforded us a yield-to-maturity of approximately 10.00%.19 In addition, we participated in the super-senior DIP financing, which, issued at 99.5 and paying LIBOR + 250 bps, is expected to provide a yield-to-maturity of approximately 5.45%.20
Uniti Group21 – With investors concerned that the Windstream bankruptcy might have negative implications for Uniti, as the counterparty in Windstream’s prohibited sale-leaseback transaction, Uniti’s debt sold off. Income generated from the leasing of the transferred fiber assets to Windstream comprises substantially all of Uniti’s EBITDA and lenders feared that Windstream would use the bankruptcy process to reject its master lease with Uniti. We believed that Windstream would not reject the master lease because the assets are imperative to its business. However, with its primary customer in bankruptcy, Uniti’s auditors indicated that they might issue a “going concern” opinion for the 2018 10K, a default under the company’s credit agreement. Thus, Uniti needed its lenders to waive the default. At the time we began purchasing Uniti’s senior secured debt, levered 4.2x EBITDA, it had an yield to maturity of approximately 6.26%22, but we were confident that, in exchange for a waiver of the default, the lenders would require additional fees and/or an increase in coupon that would raise the expected rate of return. Thus, in exchange for a waiver of the default, Uniti agreed to provide the lenders with tighter covenants, a 200 bp interest rate increase, increasing the coupon to LIBOR + 500 bps, as well as a 125 bp consent fee. The amendment package raised the yield to maturity to approximately 8.74%.23
Special Purpose Acquisition Companies “SPACs”24 - A special purpose acquisition company, or “SPAC”, is a publicly traded “blank check” company formed with the intent to purchase an unidentified business in the future. Investors purchase freely tradeable shares collateralized by the cash proceeds, which are escrowed and invested in U.S. Treasury bills. The corporate by-laws require that the accumulated cash be returned to investors at a pre-determined liquidation date (usually two years from issuance) or following a “de-SPAC-ing” event. Such an event occurs when shareholders vote in favor of a merger or acquisition. However, each individual investor can vote to receive its pro rata portion of cash rather than shares in the new entity. Effectively, this mirrors a bond with a stated maturity that is callable sooner upon a de-SPAC-ing event. Yield-oriented investors are attracted to these vehicles because they offer yields similar to T-bills with an embedded call option on a future business combination. Of course, the devil is in the details. Cash available to redeeming shareholders is subject to corporate income taxes as well as liquidation expenses. The prospectus must be read carefully as there are carve-outs for working capital and other expenses that can affect the final value of the escrow account.
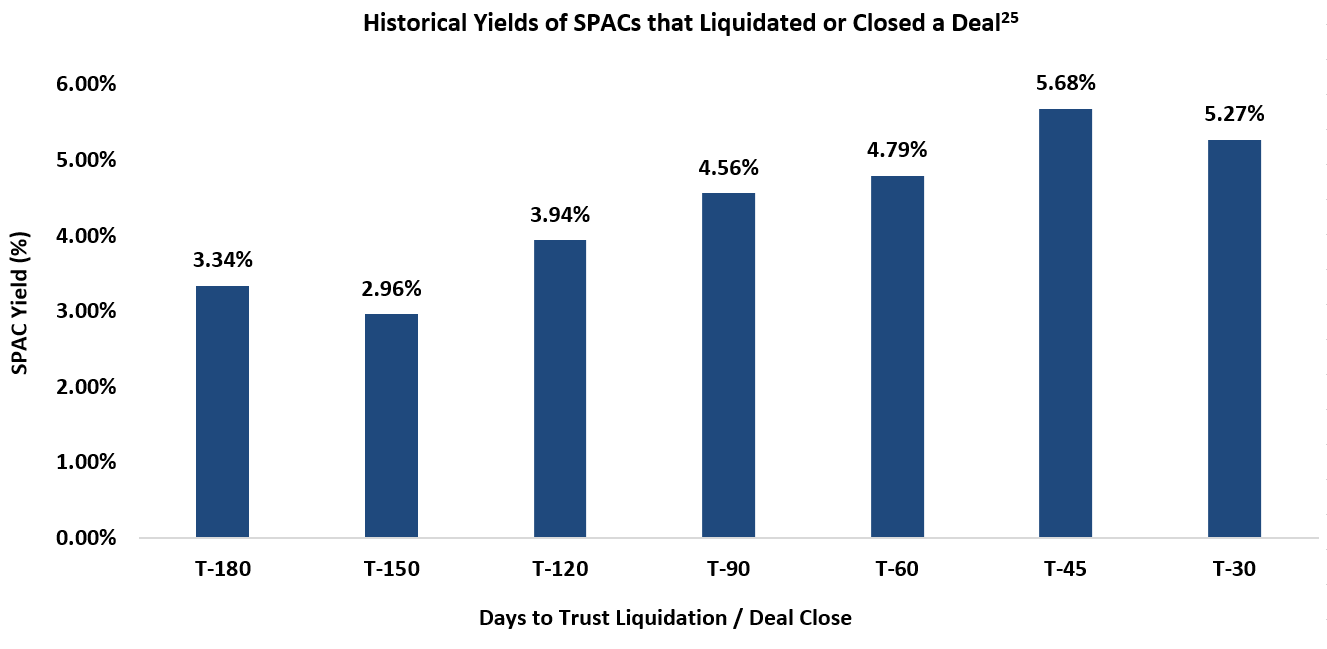
Between 2015 and 2016, 33 SPACs were issued with total proceeds of $7.4 billion. Of these, 4 were liquidated, 28 successfully closed deals, and 1 remains outstanding. Based on market prices, the graph below illustrates the yield-to-redemption an investor would have received by investing in SPACs with a remaining life less than 180 days. SPACs whose share prices traded more than $0.05 above the final trust value at deal close were excluded as it would have made more sense for an investor to sell shares in the market rather than redeem them for their cash value. This market premium over the cash value generally occurs when investors are excited about the pending transaction; hence, the value of the call option is being realized. In addition, several SPACs with limited trading volume were excluded. Interestingly, as these end-of-life SPAC’s from the 2015/2016 vintage approach their liquidation dates, the yields increase as the remaining term decreases, the opposite of what is typically observed in fixed income.
Historically, it has been difficult to accumulate large blocks of SPACs at attractive yields in the secondary market. Fortunately, the market volatility during 4Q18 triggered liquidity events that caused investors to sell their SPAC investments to raise cash in the beginning of 2019. We were there to provide liquidity and were able to accumulate meaningful exposure to SPACs with attractive short-term yields.
Poised to respond when the market reacts,

David Sherman and the CrossingBridge Team
Endnotes
1 Federal Open Market Committee – December 20th, 2018
2 The Federal Reserve established the “Policy Normalization Principals and Plans” after the September 2014 meeting of the Federal Open Market Committee to unwind the actions of quantitative easing from the Great Recession of 2008 and to return to more traditional tools used to meet the dual mandate of price stability and full employment. For additional insight and analysis, see https://www.federalreserve.gov/monetarypolicy/policy-normalization-analysis.htm
3 Source: Bloomberg, Goldman Sachs U.S. Financial Conditions Index, Board of Governors of the Federal Reserve System
4 The National Financial Conditions Index (NFCI) developed by the Federal Reserve Bank of Chicago is comprised of 105 variables to measure changes in financial conditions of the capital markets. The Financial Conditions Index can be further broken down further into three categories: Risk, Credit and Leverage. For additional information, see https://www.chicagofed.org/publications/nfci/index
5 Represented by the ICE Bank of America Merrill Lynch HY Yield Index
6 2019 US Credit Outlook North America – The Bear Has Begun, Morgan Stanley, November 25, 2018
7 Source: Bloomberg and ICE Bank of America Merrill Lynch HY Yield Index
8 Institutional herding and its price impact: Evidence from the corporate bond market, Cai, Han, Li and Li, Journal of Financial Economics, July 21, 2018. For additional information, see https://www.federalreserve.gov/econresdata/feds/2016/files/2016091pap.pdf
9 Source: Bloomberg
10 A New Take on the Relationship between Interest Rates and Credit Spreads, Dupoyet, Jiang and Zhang, October 26, 2018. For additional information, see http://faculty.fiu.edu/~dupoyetb/credit_spreads_heteroskedasticity.pdf
11 Source: Bloomberg, Morgan Stanley, Alphasense, Bureau of Labor Statistics
12 The natural rate of interest, also referred to as the “neutral rate”, is the rate at which employment and economic growth are maximized while prices remain stable. Following the sluggish output growth and low inflation after the Global Financial Crisis, some economists have argued that current interest rates remain too high and the developed countries have entered a long-term cycle in which the neutral rate is much lower than previously thought. Below are two thoughtful papers discussing the matter:
b. http://www.europarl.europa.eu/cmsdata/157015/KIEL%20final%20publication.pdf
13 The Citigroup Economic Surprise Index measures macro-economic data relative to expectations. A negative reading indicates actual economic activity disappointed expectations. The index should not be used as a forward-looking predictive tool. A paper entitled “Surprise and Uncertainty Indexes: Real-Time Aggregation of Real-Activity Macro Surprises” provides additional insight into surprise indices: https://www.federalreserve.gov/pubs/ifdp/2013/1093/ifdp1093.pdf
14 Source: Bloomberg, Citigroup, ICE Bank of America Merrill Lynch HY Yield Index
15 A DIP or Debtor-in-Possession financing provides capital for a company in bankruptcy to continue to operate while it pursues a financial restructuring. Typically, it has a super-priority security interest in the company’s assets and is repaid at the end of the bankruptcy.
16 As of 12/31/2018 our position in PGE represented 0.0% of the Low Duration Fund and 0.0% of the Long/Short Fund. As of 3/31/2019 our position in PGE represented 0.56% of the Low Duration Fund and 0.0% of the Long/Short Fund.
17 As of 12/31/2018 our position in Windstream represented 0.0% of the Low Duration Fund and 0.0% of the Long/Short Fund. As of 3/31/2019 our position in Windstream represented 3.18% of the Low Duration Fund and 0.0% of the Long/Short Fund.
18 Assuming LIBOR was at 2.64%, as was the case at the time of purchase.
19 Assuming LIBOR was at 2.63%, as was the case at the time of purchase.
20 Assuming LIBOR was at 2.63%, as was the case at the time of issuance.
21 As of 12/31/2018 our position in Uniti represented 0.0% of the Low Duration Fund and 0.0% of the Long/Short Fund. As of 3/31/2019 our position in Uniti represented 2.35% of the Low Duration Fund and 0.0% of the Long/Short Fund.
22 Assuming LIBOR was at 2.63%, as was the case at the time of purchase.
23 Assuming LIBOR was at 2.63%, as was the case at the time of covenant waiver took effect.
24 As of 12/31/2018 our position in SPAC’s represented 0.22% of the Low Duration Fund and 0.00% of the Long/Short Fund. As of 3/31/2019 our position in SPAC’s represented 7.92% of the Low Duration Fund and 0.00% of the Long/Short Fund.
25 SPACResearch.com, SEC filings, Bloomberg.
- SPAC IPO Transactions – Summary by Year
- 2019 YTD – 17 IPOs, $3.7bn gross proceeds
- 2018- 46 IPOs, $10.7bn gross proceeds
- 2017 – 34 IPOs, $10.0bn gross proceeds
- 2016 – 13 IPOs, $3.5bn gross proceeds
- 2015 – 20 IPOs, $3.9bn gross proceeds
Disclosures
The fund’s investment objectives, risks, charges and expenses must be considered carefully before investing. The statutory and summary prospectus contain this and other important information about the investment company, and it may be obtained by calling 1-888-898-2780 or visiting our website at: https://www.crossingbridgefunds.com/literature. Read it carefully before investing.
Opinions expressed are subject to change at any time, are not guaranteed and should not be considered investment advice. Fund Holdings and sector allocations are subject to change and should not be considered a recommendation to buy or sell any security.
*Definitions: The ICE BofAML 0-3 Year US Treasury Index is tracks the performance of US dollar denominated sovereign debt publicly issued by the US government in its domestic market with maturities less than three years. The ICE BofAML 1-3 Year US Corporate Index is a subset of the ICE BofAML US Corporate Index including all securities with a remaining term to final maturity less than three years. The ICE BofAML US Corporate Index tracks the performance of US dollar denominated investment grade corporate debt publicly issued in the US domestic market. The ICE BofAML 0-3 Year US High Yield Excluding Financials Index tracks the performance of short maturity US dollar denominated below investment grade rating (based on an average of Moody’s, S&P, and Fitch), at least 18 months to final maturity at the time of issuance, at least one month but less than three years remaining term to final maturity as of the rebalancing date, a fixed coupon schedule and minimum amount outstanding of $250 million. It is not possible to invest directly in an index. The Chicago Board Options Exchange (CBOE) Volatility Index, or VIX, shows the market’s expectation of 30-day volatility, and is a commonly used measure of market risk. Basis point (BPS) refers to a common unit of measure for interest rates and other percentages in finance. One basis point is equal to 1/100th of 1%, or 0.01%, or 0.0001, and is used to denote the percentage change in a financial instrument. The S&P 500 or Standard & Poor's 500 Index is a market-capitalization-weighted index of the 500 largest U.S. publicly traded companies. ICE Bank of America Merrill Lynch HY Bond Index tracks the performance of US dollar denominated below investment grade corporate debt publicly issued in the US domestic market. Qualifying securities must have a below investment grade rating (based on an average of Moody’s, S&P and Fitch), at least 18 months to final maturity at the time of issuance, at least one year remaining term to final maturity as of the rebalancing date, a fixed coupon schedule and a minimum amount outstanding of $100 million. The Citigroup Economic Surprise Index measures macro-economic data relative to expectations. A negative reading indicates actual economic activity disappointed expectations. The index should not be used as a forward-looking predictive tool. Yield to maturity (YTM) is the total return anticipated on a bond if the bond is held until it matures. Cash flow is the net amount of cash and cash-equivalents being transferred into and out of a business. Par, short for "par value," par can refer to bonds, preferred stock, common stock or currencies, with different meanings depending on the context. Par most commonly refers to bonds, in which case, it means the face value, or value at which the bond will be redeemed at maturity. Coupon is the interest rate paid by a fixed-income security; a fixed-income security's coupon rate is simply just the annual coupon payments paid by the issuer relative to the bond's face or par value. LIBOR is a benchmark interest rate at which major global banks lend to one another in the international interbank market for short-term loans. LIBOR, which stands for London Interbank Offered Rate, serves as a globally accepted key benchmark interest rate that indicates borrowing costs between banks. Earnings before interest, tax, depreciation and amortization (EBITDA) is a measure of a company's operating performance.
Mutual fund investing involves risk. Principal loss is possible. Investments in foreign securities involve greater volatility and political, economic and currency risks and differences in accounting methods. Investments in debt securities typically decrease in value when interest rates rise. This risk is usually greater for longer-term debt securities. Investment in lower-rated and non-rated securities presents a greater risk of loss to principal and interest than higher-rated securities. The Fund may make short sales of securities, which involves the risk that losses may exceed the original amount invested. Because the Fund may invest in ETFs and ETNs, they are subject to additional risks that do not apply to conventional mutual funds, including the risks that the market price of an ETF’s and ETN’s shares may trade at a discount to its net asset value (“NAV”), an active secondary trading market may not develop or be maintained, or trading may be halted by the exchange in which they trade, which may impact a Fund’s ability to sell its shares. The value of ETN’s may be influenced by the level of supply and demand for the ETN, volatility and lack of liquidity. The Fund may invest in derivative securities, which derive their performance from the performance of an underlying asset, index, interest rate or currency exchange rate. Derivatives can be volatile and involve various types and degrees of risks, and, depending upon the characteristics of a particular derivative, suddenly can become illiquid. Investments in Asset Backed, Mortgage Backed, and Collateralized Mortgage Backed Securities include additional risks that investors should be aware of such as credit risk, prepayment risk, possible illiquidity and default, as well as increased susceptibility to adverse economic developments.
Diversification does not assure a profit nor protect against loss in a declining market. Diversification does not assure a profit nor protect against loss in a declining market. It is not possible to invest directly in an index.
Distributor: Quasar Distributors, LLC
Credit ratings are published by credit rating agencies - S&P, Moody’s - and used by investment professionals to assess the likelihood the debt will be repaid. The ratings are generally expressed as a scale from AAA to D, where higher-rated bonds are in the A’s an lower-rated in the C’s. Any bond rated BBB or higher is considered investment grade debt.