
The recent NCAA college basketball tournaments remind us that players regularly come off the bench to give their teams an extra boost.
![]()

Getting off the Bench(mark)
The recent NCAA college basketball tournaments remind us that players regularly come off the bench to give their teams an extra boost. Many fixed income investors seem focused on capturing the benchmark rate of return yet are failing to acknowledge that on-the-run1credit spreads are very tight and may be undercompensating for risk.2 In this market, with all of its uncertainties, it is imperative that credit investors get off the bench and find better ways to invest in fixed income Moreover, just as in basketball, this market will require both a strong defense, to protect capital, and an offense ready to identify and take advantage of scoring opportunities.
Option-Adjusted Spread (OAS) as % of Yield-to-Worst (YTW)3
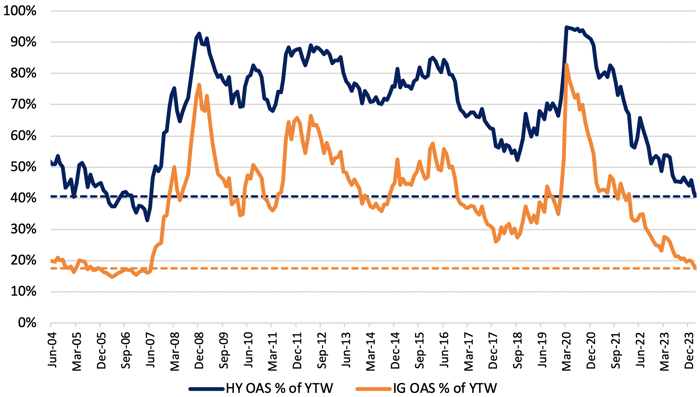
Fewer scoring opportunities - As shown above, credit spreads are near historic lows and, as a percentage of the total yield,4 at their lowest level since the first half of 2007. Assuming everything goes according to the game plan, debt investors’ expected return is highly correlated to U.S. Treasuries of similar maturity with little value associated with underwriting credit risk. This creates a conundrum for investors with disparate outcomes depending on the economy:
- Robust economy - Inflation may reignite causing rates to rise and bond prices to fall.
- “Soft Landing” – Investors’ returns are similar to movement in Treasury rates.
- Weaker Economy – Credit spreads widen, likely causing corporate bond prices to fall.
Distribution of BBB and BB Option-Adjusted Spreads 2004-245
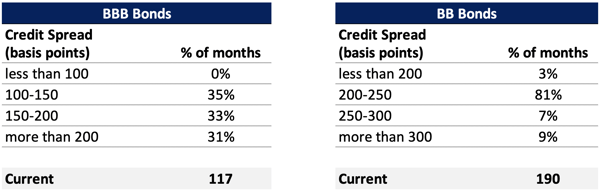
Taking a more granular view, the table above shows the distribution of credit spreads for the lowest quality investment grade bonds (BBB) and the highest quality junk bonds (BB) over the last twenty years. Currently, BBB credit spreads are, on average, 117 basis points, lower than the average BBB credit spread in 92% of the monthly periods since 2/29/04.6 Concurrently, BB credit spreads are lower than the level seen in 97% of the quarterly periods since 2004. Some high yield strategists have been pointing to the lowest quality performing segment, CCC-rated bonds, as an opportunity. However, investing in such low-quality credit requires a “full court press”, a thorough examination of all aspects of the investment, in the hope of uncovering these mispriced opportunities overlooked by the rest of the market. At this point in the cycle, we have our doubts. A high yield salesperson who we respect and have known for over 25 years recently asked: “Can you guys do emerging markets? That’s what all my distressed guys are doing because they can’t find anything here.” As none of our funds include emerging markets in their mandate and it is outside our core expertise, we will just stay in our lane without FOMO.7
US New Chapter 11 Bankruptcy Filings8
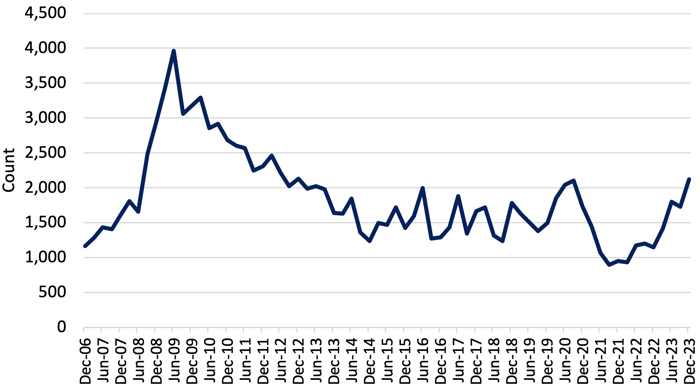
The best offense is a good defense – Outperformance over the next year may be more a function of playing defense, defending one’s capital, than going on offense and seeking to make a high-flying slam dunk – in low quality high yield or in emerging markets – every time down the court. Since 1Q22, when the Fed began raising rates to combat inflation, the number of new Chapter 11 filings in the U.S. has more than doubled. Elevated rates are stressing companies that have high levels of debt and are giving “sticker shock” to those that are financed with floating rate debt and/or must go to the high yield market to refinance. The higher cost of debt is largely a function of elevated underlying interest rates9 as credit spreads, as discussed above, are tight, not yet reflecting the rise in credit risk suggested by the increase in total Chapter 11 filings. Recently, we have seen a surge in new issuance of investment grade, high yield and syndicated bank debt as companies strive to take advantage of tight credit spreads while pushing out their maturities, despite higher interest rates. This may turn out to be a prudent move by corporate treasurers.
Altice France
2.5% Secured Note due 1/15/25 versus
3.375% Secured Note due 1/15/2810
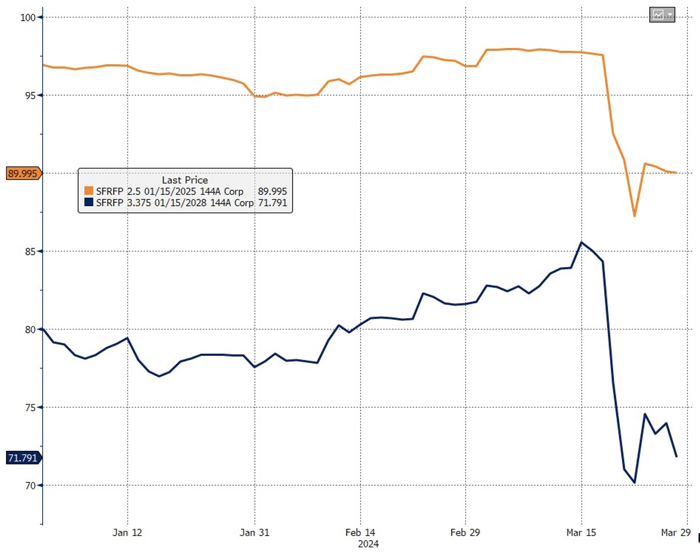
The clock is not your friend – Down five points with 15 seconds remaining on the clock, your team is likely to lose the game. For stressed companies and their bondholders, upcoming maturities may be the final buzzer. Reaching for yield in short maturity paper of stressed credits can be a dangerous play; longer-dated maturities of the same issuer trading at a substantial discount to par are often the tip-off. We refer to this activity as “Merry-Go-Round Investing.” Effectively, the short maturity investor is betting that they will get off the merry-go-round before time runs out. In March, two large European issuers, Intrum and Altice France, indicated that it may be difficult for them to pay off bonds maturing in 2024 and 2025 and needed to begin discussions with bondholders regarding a broader restructuring. Per the graph above, the announcement by Altice France’s management precipitated a sharp drop in the price for its 2025 secured bond and the company’s pari-passu 2028 bond which was already trading at a significant discount, suggesting distress. Nothing like a 10-point drop in your short-term bond to make you queasy, realizing that you stayed on the merry-go-round too long.
Annual Recovery Rate by Seniority11
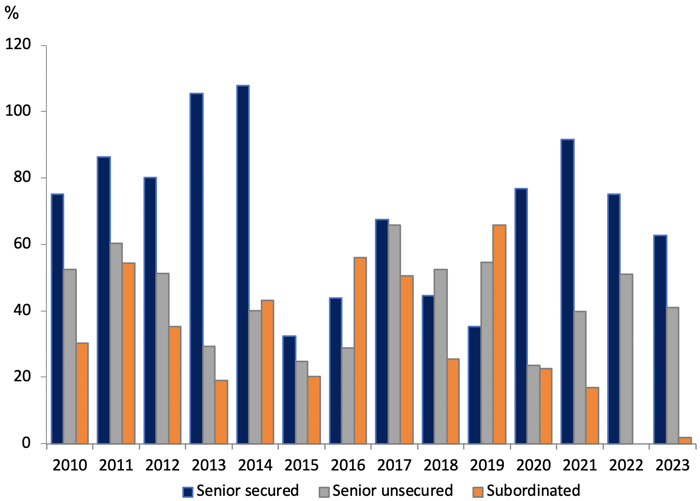
Protect the ball - Do you want to invest at the top of the capital structure, the middle, or the bottom? As shown above, if defense, protection of capital, is a priority, investing in senior secured debt has provided the greatest level of safety, as demonstrated by the average recovery rate for distressed instruments, in the high yield market. That said, investors’ demand for yield may be over-riding their interest in safety. In a recent Jefferies research report,12 a comparison of the yield for pairs of secured and unsecured instruments issued by the same company revealed that, in some cases, investors were willing to give up the benefits of a secured claim and significantly lower leverage in order to capture as little as 6 basis points of incremental yield. A recent Barclays study13 goes further, concluding that bond-level issue selection provides an enhancement to issuer selection in the context of actively managed fixed income portfolios. They go on to show that bonds of the same issuer may perform differently depending on their priority in the capital structure, issue size and market liquidity, variance in covenant protection, position in the maturity schedule, etc. Moreover, Barclays demonstrates that, after normalizing for several factors,14 the potential to generate alpha via issue selection is greatest for lower quality bonds, particularly those rated CCC/Caa, where bond-specific factors drive greater variance in outcome. As bottom-up, value-driven investors we are fully aware of the benefits of issue and issuer selection.
Low Average Corporate Bond Prices Make Change-of-Control
More Valuable15
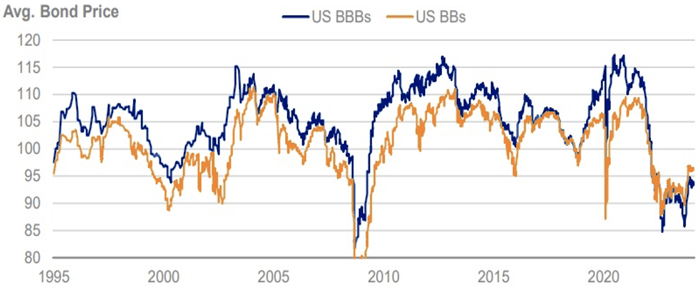
You make your own luck by being prepared - With interest rates having fallen from their peak and a wide-open corporate bond market, we appear to be at the beginning of a resurgence in M&A after a very slow 2023. According to Morgan Stanley, globally listed non-financial corporations hold in excess of $5.6 trillion in cash and private equity investors have over $2.5 trillion of “dry powder” ready to be deployed into acquisitions.16 Given that interest rates remain relatively high, the buyers are more likely to be corporations. However, if we see a decline in interest rates, we may also see a rise in acquisition activity among private equity sponsors. There are several ways that M&A can factor into event-driven credit investing. For instance, as shown above, bond prices for BBB and BB high yield bonds are, on average, trading below 100. An announcement that a high yield issuer is being acquired by an investment grade company would usually cause the target’s bonds to quickly jump up toward 100 and, possibly, above par to trade in line with acquiror’s bonds if it seems likely that that bond will remain outstanding after the merger is effective. Alternatively, the acquisition may trigger a change-of-control provision in a bond indenture allowing bondholders to demand repayment (usually at a price of 101) when the deal is completed. Although such terms are far more common in high yield bonds where 88% of indentures include this covenant, 28% of investment grade bonds (mostly among BBB bonds) also include them.17 Thus, given the large cohort of corporate bonds trading below par, a rise in acquisition activity may be a catalyst for significant upside. We are on the lookout for high quality debt, with change-of-control “puts”18, of potential acquisition targets trading at benchmark yields with the hope that we get lucky. Conversely, bonds that lack change-of-control covenants, often investment grade credits, are at risk of a sudden price decline if the issuer is acquired by a high yield credit or a private equity sponsor who intends to add leverage and leave the bonds outstanding – sometimes called “screwing the bondholder” for the benefit of shareholders. 😉
2010-24 US HY Primary Market Issuance by Use of Proceeds19
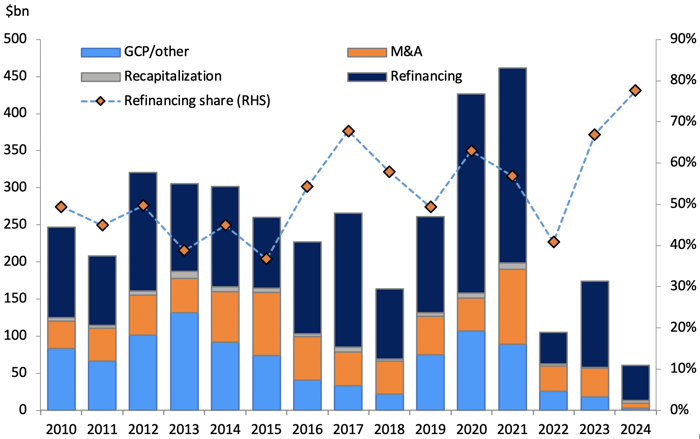
Anticipate where the ball is going - According to Goldman Sachs,20 a record high 78% of high yield capital raised year-to-date in 2024 has been used to refinance upcoming maturities. Meanwhile, as noted above, a significant portion of the high yield bond market is trading at a discount to par due to the rise in interest rates. Thus, the YTW for a bond, which equals the yield-to-maturity (YTM) for bonds trading below par, may be understating the likely yield to be realized for a given bond if one anticipates it being repaid before the bond “goes current”, one year before maturity. Typically, companies prefer to refinance their debt at least one year prior to maturity to avoid showing a large block of current debt on their balance sheet, which might raise concerns for their auditors. As such, one of our approaches has been to focus on bonds and loans based on their “yield-to-go-current”, anticipating an early refinancing. According to Barclays,21 high yield bonds that are repaid 12 months prior to maturity capture, on average, 45 basis points of incremental yield over the market’s average YTM.
Due to the inversion of the yield curve, some companies have an arbitrage opportunity to refinance their short-dated maturities via defeasance. By issuing long term debt and using the proceeds to invest in money market securities and U.S. Treasuries set aside to defease outstanding short-term debt, they are able to take advantage of high short-term rates while successfully pushing out their debt maturities. In these cases, we sometimes find attractive opportunities to invest in short-term high yield bonds that are fully collateralized by cash alternatives.
Historic Composition of Defaults in US HY Market by Type22
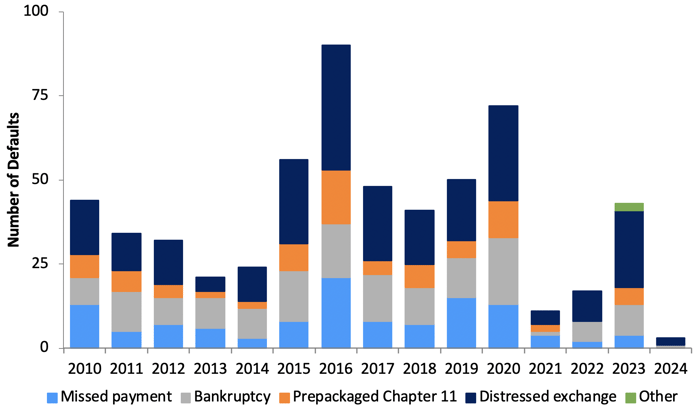
Rebounding turns into scoring opportunities - The rise in defaults and restructurings in 2023 and 2024 is presenting us with opportunities for rebounds as we often find that post-reorg debt can be attractive. Taking a “time out” during restructuring, companies will often aggressively cut costs, refine their business plans and, most importantly, reduce leverage. The financial restructuring, either in or out of court, often leads to the exchange of new debt for old or the issuance of new debt to repay creditors and fund the company following the reorganization. Typically, this new debt, crafted by vulture investors and restructuring professionals, has tight covenant packages designed to control the company’s cash flow and prevent further distress. Because the credit is tainted by its troubled history, the investor base for post-reorg debt is often limited, leading to higher coupons. Also, following a restructuring, many lenders, including CLOs and hedge funds, who have received new debt in exchange for their pre-reorg claims, become “un-natural holders”, primed to sell. We often find these investment candidates attractive as, once the restructuring has been completed, the company has a better, cleaner capital structure, giving it a fresh start.
Nordic High Yield Market Size and Credit Spread vs
US High Yield Option-Adjusted Spread23
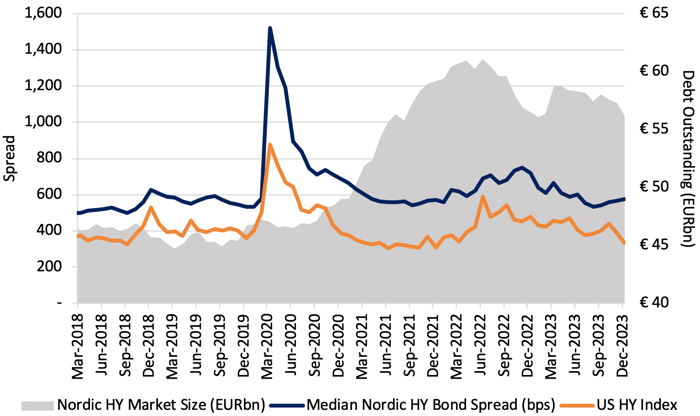
There are good players overseas - Having been involved in the Nordic high yield market since the mid-2000s, we have developed our knowledge base and found opportunities in bonds with better credit metrics, higher yields and better covenants than we find in the U.S. high yield market. By comparison to the U.S. market which has approximately $1.4 tn in bonds outstanding, the Nordic market is tiny, but growing fast, from less than €14.0 bn in 2007 to over €56.0 bn in 2023. So far, we have found sufficient new issuance activity and secondary market liquidity to justify our participation in this market. With respect to yield, the graph above shows that the average credit spread for Nordic high yield bonds has been consistently higher than the option-adjusted spread of the ICE BofA US High Yield Index, on average by 211 basis points, since early 2018. In its earlier days, the Nordic market was highly concentrated in oil & gas and shipping but is much more diverse today. Shipping represents about 7% of the market and oil & gas represents approximately 16%.24 The typical Nordic high yield credit has lower net leverage than we find in the U.S. Nordic bonds generally have 3- to 5-year maturities, are floating rate, are secured by assets and provide strong bondholder protections including debt incurrence and dividend limitations and, sometimes, maintenance requirements (e.g. minimum liquidity). The Nordic bond market reminds us of the leveraged loan market of the early 1990s when investors achieved significantly better returns with less risk than the leveraged loans we see today.
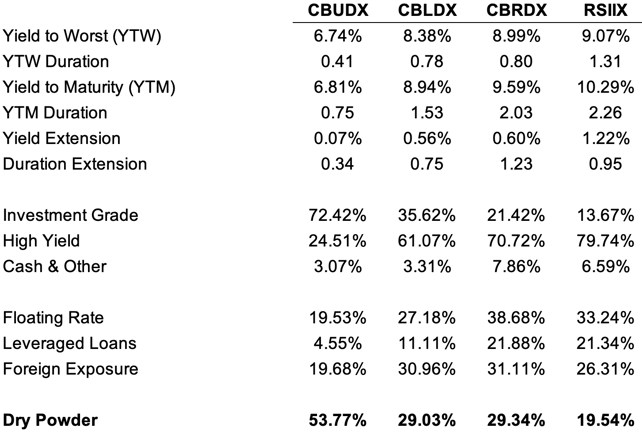
*Dry Powder is defined as cash, cash equivalents, pre-merger SPACs, and maturities of 90 days or less.
Positioning is critical – The table above provides some key metrics reflecting portfolio positioning at quarter end. We continue to take advantage of the inverted yield curve, favoring the high income from the short end of the curve rather than speculating on the timing and magnitude of Fed rate cuts for an uncertain total return. As part of our defensive strategy, we are emphasizing investments higher up in the capital structure and foreign corporate debt. In our 4Q23 letter, we discussed the potential for volatility in the markets due to “a convergence of economic, political, social, and technological transformation.” This view has not changed. Thus, we are actively managing our “dry powder” to remain nimble to take advantage of opportunities should they arise.
We are energized by our fans and encourage our investors to reach out to discuss our strategies in more detail.
There are no slam dunks,

David K. Sherman and the CrossingBridge Team
Endnotes:
1 “On-the-run” credit spreads are those implied by the yield of the most frequently traded credit instruments.
2 There are many different types of risk including, but not limited to credit, interest rates (i.e. duration) and collateral (unsecured vs. secured, working capital vs. real estate).
3 Bloomberg, option-adjusted credit spread and yield-to-worst for the ICE BofA US High Yield Index and the ICE BofA US Corporate Index from 6/30/04 to 3/31/24
4 OAS divided by YTW. The yield-to-worst (YTW) of a fixed income security is the lowest possible yield that an investor would receive for a bond, based on its optional call schedule, without defaulting. The option-adjusted-spread (OAS) is the difference between the YTW of a fixed income security and the yield of a Treasury security of comparable maturity, adjusted for embedded options permitting the issuer to prepay the instrument.
5 Bloomberg, ICE BofA BBB US Corporate Index and BB US High Yield Index, data from 2/29/04 to 3/31/24
6 Bloomberg, ICE BofA BBB US Corporate Index and BB US High Yield Index, data from 2/29/04 to 3/31/24
7 “Fear of missing out.”
8 Bloomberg <BANBT11>, US New Bankruptcy Cases Chapter 11 Filings
9 The underlying rates for fixed rate instruments are U.S. Treasury rates. The underlying rates for floating rate loans are the one- or three-month Treasury rates or SOFR, the Secured Overnight Financing Rate.
10 Bloomberg, Altice France 2.5% Secured Note due 1/15/25 and 3.375% Secured Note due 1/15/28, price history from 12/31/23 to 3/28/24
11In refi mode, Goldman Sachs, March 7, 2024, annual data from 2010 to 2023
12JEF LBO Monitor, Jefferies, March 27, 2024
13Value of bond versus issuer selection in credit, Barclays, February 5, 2024
14 Barclays normalizes for the number of bonds per issuer, liquidity effects, and spread curve effects.
15 The Return of M&A (presentation), Morgan Stanley, March 11, 2024
16 The Return of M&A, Morgan Stanley, March 4, 2024
17 The Return of M&A, Morgan Stanley, March 4, 2024
18 A change-of-control “put” would give the bondholder the ability to put the bond to the issuer i.e. require it to repay the bond upon completion of the issuer’s sale, subject to specified conditions.
19 In refi mode, Goldman Sachs, March 7, 2024, annual data from 2010 through February 2024
20 In refi mode, Goldman Sachs, March 7, 2024
21 More yield than meets the eye, Barclays, February 23, 2024
22 In refi mode, Goldman Sachs, March 7, 2024, annual data from 2010 through February 2024
23 Nordic Bond Report, Pareto Securities, January 30, 2024, the spread-to-worst over the Swedish Krona benchmark bond yield as per the Pareto Securities Scandinavian Fixed Income and Research High Yield Index and the option-adjusted spread for the ICE BofA US High Yield Index, data from 2/28/18 to 12/29/23
24 Nordic Bond Report, Pareto Securities, January 30, 2024
SEC Yields as of 3/31/24 (Subsidized/Unsubsidized):
CrossingBridge Low Duration High Yield Fund (CBLDX): 8.23%/8.23%
CrossingBridge Ultra-Short Duration Fund (CBUDX): 6.30%/6.20%
CrossingBridge Responsible Credit Fund (CBRDX): 8.57%/8.02%
RiverPark Strategic Income Fund (RSIIX): 9.14%/9.14%