
Written in 1965, a tumultuous time of social change and civil unrest, the song, People Get Ready, expresses optimism that faith and love will win out. Today, there is a convergence of economic, political, social, and technological transformation. This is likely to cause changes in our daily lives and may bring about a significant increase in volatility in the financial
![]()
People Get Ready1
People get ready, there's a train a-comin'
You don't need no baggage, you just get on board
Written in 1965, a tumultuous time of social change and civil unrest, the song, People Get Ready, expresses optimism that faith and love will win out. Today, there is a convergence of economic, political, social, and technological transformation. This is likely to cause changes in our daily lives and may bring about a significant increase in volatility in the financial markets, both positive and negative. We are not in the business of predicting these outcomes nor are we likely to catch a wave of momentum that sweeps through the capital markets based on forecasts.2 Rather, we are value investors and expect to outperform in the long-term by taking a bottom-up approach, focusing on companies that will generate cashflows to meet their obligations as they approach their day of reckoning (also known as “maturity”).3 Although change may be disruptive, it allows us to embrace the opportunities created by greed and fear.
Notwithstanding our bottom-up approach, we have several thoughts regarding the macroeconomic environment:
- The yield curve is likely to flatten and should ultimately normalize to an upward sloping curve instead of the inversion we have today.
- Risk premium will return to compensate investors and curb speculation.
- Inflation has abated from the recent highs but will remain elevated similar to the 1990s when it averaged 2.80%.
- On a risk-adjusted basis, the portion of the yield curve we find most attractive has a maturity of 3 years or less.
- The underpinnings of the U.S. economy are more durable than generally perceived. For example, the banking crisis4 of spring 2023 was short-lived and easily contained.
Fed Funds Futures vs FOMC "Dot Plot"5
December 29, 2023
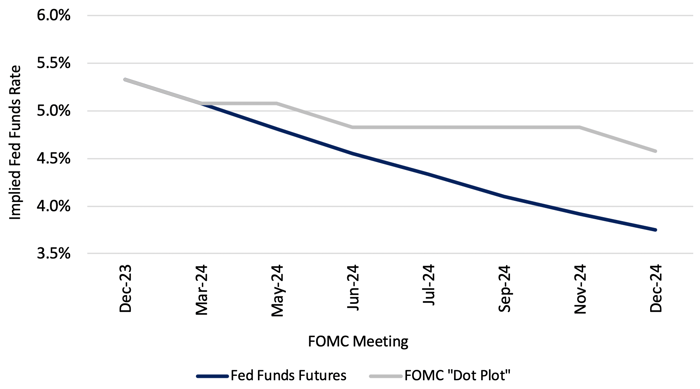
At year-end 2023, Fed Funds Futures were projecting seven 25 basis point reductions in the Fed Funds Rate, totaling 175 basis points, and bringing the rate down to approximately 3.75% by the end of 2024. This is in sharp contrast to the “dot plot”6 which indicated expectations for a total decline of 75 basis points to an effective rate between 4.50% and 4.75%. Clearly one of these projections, and perhaps both, will be wrong with significant ramifications for the markets.
US Treasury Yield Curves7
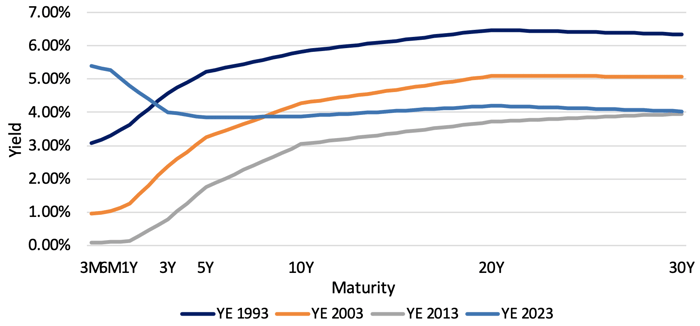
The graph above shows the yield curve as it was at year end and as of 10, 20 and 30 years ago. The difference is stark and shows that, in order to achieve a “normal” yield curve, rates will need to decline for maturities less than three years.8 If the projection for short-term rates based on Fed Funds Futures is correct, the curve would be essentially flat; if the dot plot is correct, the curve would still be inverted. In both cases, the real rate of interest9 would still be positive. Thus, if it is the Fed’s objective to achieve a normal curve and restore the proper incentives with respect to speculation, investment and lending, short rates will need to fall further and/or longer rates will need to rise.
IG and HY Option-Adjusted Spreads % YTW and 10-Year Treasury Term Premium10
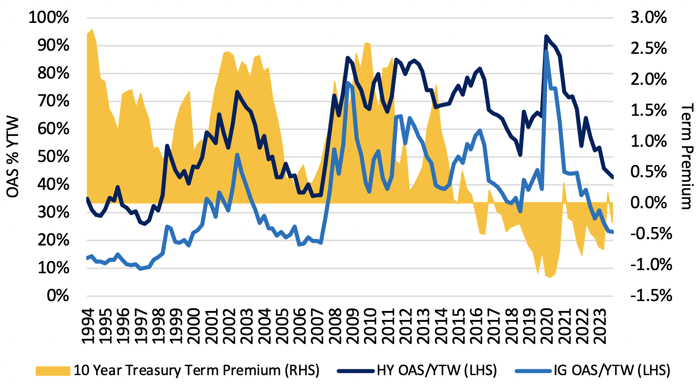
In our opinion, the fixed income markets are underpricing risk. The 10-year U.S. Treasury term premium reflects the additional compensation that investors earn by taking on the risk11 of investing longer-term. At year-end, the term premium was negative, providing little incentive to make long-term fixed income investments other than for asset/liability matching or interest rate speculation. Credit spreads reflect the additional premium paid to investors for underwriting repayment risk. As a percentage of the yield-to-worst (YTW) earned on investment grade (IG) and high yield (HY) debt, credit spreads are low. The graph above illustrates this point by comparing the credit spreads on IG and HY debt to the YTW of each type of debt. At year-end 2023, the credit spread as a percentage of the YTW for IG debt was 23% while, for HY debt, the credit spread was 43% of the YTW, the tightest levels since the ’05-06 period. As value investors, our job is to find investments for which one is compensated for term premium and credit risk.
Public Approval of Labor Unions, Wage and Income Growth12
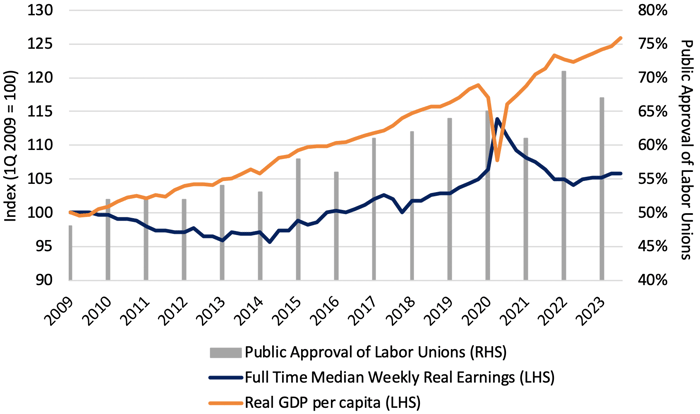
An ongoing rise in wages, which both drives up costs for employers and increases consumer demand (since workers will have more money in their pockets) will likely cause inflation to remain elevated. Despite the 10-year rise in real earnings shown above, real per capita GDP has been growing faster than real earnings, widening the wealth gap, and causing workers to feel that they have been left behind while corporate profits rise to the benefit of stock market investors. Although the low level of unemployment since COVID has been an important factor in recent wage increases, the rising public approval of unions may have enhanced the effectiveness of collective bargaining, another driver of real wage gains.
The Sahm Rule Indicator13
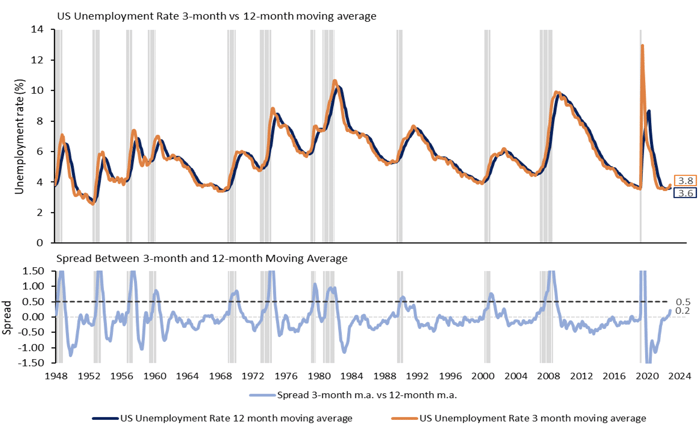
Some are arguing that we are headed toward a recession based on the recent rise in unemployment. There is the potential for this to continue, but this concern would be reduced if the Fed follows its own dot plot and reduces short-term interest rates. Moreover, unemployment is lower than in 86% of the monthly periods going back to 1948. The last recession that started when unemployment was lower than it is currently was in 1970. Thus, while the Sahm Rule Indicator14, shown above, may be “flashing yellow” with respect to rising risk of recession, a recession that starts with such low unemployment is likely to be mild.
Money Market Fund Assets % of Investment Grade Corporate Bonds15
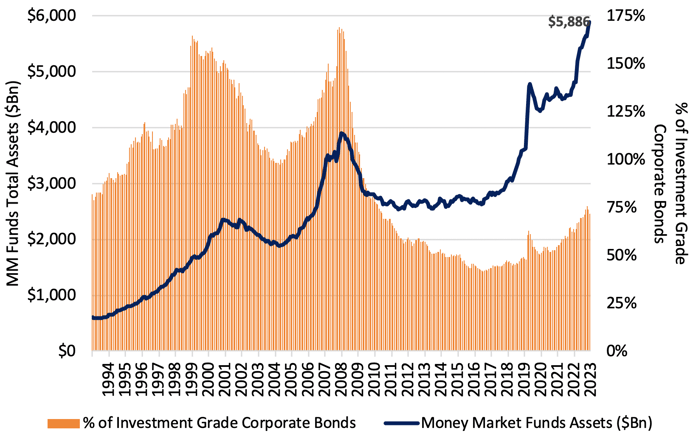
We believe that cash is a legitimate asset class to hold when one is not being paid appropriately for risk. The $1.2 trillion spike in money market assets over the last 24 months reflects investors seeking to capture the high short-term interest rates resulting from the Fed’s restrictive monetary policy. Money market fund assets are at a 30-year high, but this generally reflects the growth in dollars in the economy as a result of inflation and market appreciation in all asset classes over the last three decades. Moreover, as a percentage of the capital in most asset classes (investment grade bonds are shown as an example above), money market funds are far from their highest level. We are mindful that significant flows of capital in or out of an asset class can drive rapid price movement, both up and down.
European Materials Company16
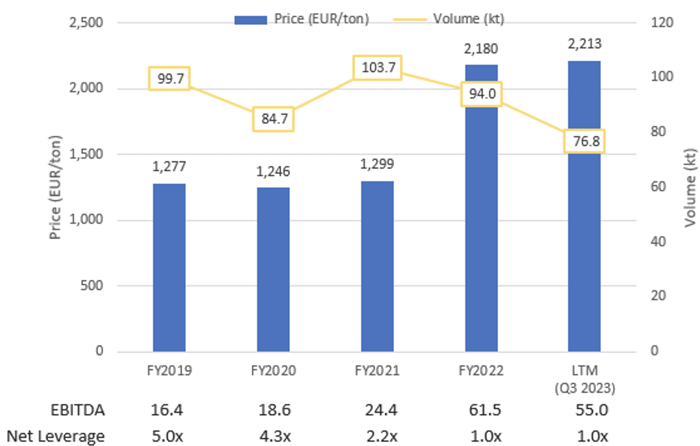
More directly related to credit quality, we have concern with respect to future corporate profitability. As a result of COVID-related supply chain constraints and increased raw material and labor costs, companies found it relatively easy to achieve price increases over the last few years, improving profit margins. The good news is that companies were able to build cash, repay debt and generally improve their capital structures. We are concerned, however, that this is not sustainable. Since peaking in January 2022 at 10.0 (on a 1-10 scale), supply chain congestion, according to Goldman Sachs,17 has declined to 2.0 at year-end 2023, reducing this cost pressure. For example, the graph above reflects the recent performance of a private company whose bonds we hold. The company has been able to de-lever over the past few years as a result of sharply higher pricing applied to relatively stable volume.18 Most recently, however, volume has declined while pricing has remained high. As a result, we have already seen a 10% decline in EBITDA in the last 12-month period ended 9/20/23. This raises the question as to whether there is price elasticity such that a reduction in price would spur higher demand. Similar to many companies that produce specialized, value-added products, it seems unlikely that a reduction in price would have a significant impact on demand. However, this company has high operating leverage so that a change in volume has a much greater impact on profitability and poses a risk to profitability. A slowing economy would raise concerns with respect to demand for companies throughout the economy; the possibility should not be dismissed.
On December 13, 2023, the 2-year Treasury rate declined by 30 basis points following the release of the Fed’s statement from its FOMC meeting. This also drove sharp rallies in equities and corporate credit. The reaction to the Fed’s announcement reminds us of the markets’ volatility and unpredictability. During 2023, the 10-year Treasury yield rose from 3.25% in April to 5.00% in October and finished the year below 4.00%. As we have seen, this type of volatility is a double-edged sword that can cut both ways. While we are cognizant of the top-down/macro landscape, we do not manage the portfolios to capture gains by predicting short-term swings in price or yield. In line with our core philosophy and process, our portfolios are purely reflections of the bottom-up opportunities we are seeing in the market, not a ‘bet’ on duration/direction of rates. We are more comfortable with a disciplined approach to value to produce respectable and responsible long-term returns for our investors.
Below are some themes in which we find value and examples of portfolio holdings:
- Misunderstood or challenged investment-grade debt
- Tapestry/Coach19
- New 2-year issue for Coach acquisition of Michael Kors which has a put option at 101 should the transaction not close in a timely fashion.
- Warner Media20
- Investment grade issuer aggressively deleveraging.
- CMBS (excluding center city office)21
- CMBS rated AA and A with maturities under 3 years that are priced to extension but if paid off at maturity will generate a significant increase in yield. Spreads are equivalent to B/BB high yield with high quality, low Loan-to-Value (LTV) on primarily industrial, distribution and logistics assets.
- CMBS rated AA and A with maturities under 3 years that are priced to extension but if paid off at maturity will generate a significant increase in yield. Spreads are equivalent to B/BB high yield with high quality, low Loan-to-Value (LTV) on primarily industrial, distribution and logistics assets.
- Deleveraging and event-driven debt
- Clear Channel Outdoor International22
- Secured debt issued during COVID on European assets which are currently being sold, often at prices above estimates, in order to convert the company into a US REIT. Upon disposition of assets, the secured debt is required to be paid off.
- NGL23
- Secured debt of midstream gas company that is aggressively de-levering and expected to get upgraded.
- Chobani24
- The company has stated its intention to refinance its debt and is considering re-engaging IPO process for 2024.
- HMH25
- Issued at around a 10% YTM in 2023 to refinance and extend debt maturity. Although the company lowered its interest cost going forward, we continue to find the credit attractive.
- Infrabuild26
- Issued at around a 15% YTM to refinance debt while allowing a dividend to its parent company. Debt covenants are extremely tight and more restrictive than prior issue. The yield is high because there are concerns regarding the issuer’s parent, but Infrabuild is ring-fenced.
- Stockwik27
- Tightening Debt/EBITDA leverage maintenance tests at end of 1Q24 may require bondholder amendment or additional equity raise. Net debt leverage will be below 3.8x.
- Icahn Enterprises28
- Short-seller report caused entire debt structure to sell off. The company reported assets exceed debt and 3Q23 reported satisfactory results. All debt is unsecured. Significant levers to pay off short-term maturities including large cash & marketable securities and the ability to issue secured debt.
- Short-seller report caused entire debt structure to sell off. The company reported assets exceed debt and 3Q23 reported satisfactory results. All debt is unsecured. Significant levers to pay off short-term maturities including large cash & marketable securities and the ability to issue secured debt.
In 2023, the seventh edition of Security Analysis by Benjamin Graham and David Dodd29 was issued, edited by esteemed value investor Seth Klarman, and including new commentary from an array of well-respected investors. In Introduction to Part V: The Evolution of a Value Investor,30 there is a passage in which my mentor, Joe Steinberg, and Ian Cumming, discuss the essence of value investing. We share these remarks as they clearly encapsulate our approach:
“Since we believe investors cannot successfully “time” the market, we believe cash should be the residual component of the investment process. When there are no compelling opportunities at hand, we choose to wait. Sitting on your hands can be difficult when you see the portfolios of others increase in value, but we believe this is better than owning positions you don’t find attractive. In their fiscal year 2000 Annual Letter to Shareholders, Leucadia National Corporation’s former chairman, Ian Cumming, and former president, Joseph Steinberg, spoke to this dynamic, likening themselves to groundhogs: “We pop out of our holes each and every morning and look around the marketplace for investment opportunities. The first question we ask is, ‘Do we see anything that can earn more than the risk-free rate, adjusted for risk?’ When the markets are as high as they have been in the last many years, we saw very little of interest and went back down in our holes…Patience is required for this process, but it is not complicated.”
Patiently Waiting,

David K. Sherman and the CrossingBridge Team
Endnotes:
1The song “People Get Ready”, originally recorded in 1965 by the Impressions, was written by the group’s lead singer, Curtis Mayfield. It is a response to the rapid social change and civil unrest of another era, but its message resonates today in a time when rabid partisanship, deepening rifts on social issues and sharply different views within the electorate.
2As seen in November and December
3In the case of stressed and distressed situations, the objective is more likely to be “return of capital in excess of purchase price” rather than repayment in full at maturity.
4In spring 2023, First Republic Bank, Silicon Valley Bank, and Signature Bank, the 14th, 16th and 29th largest U.S. banks ranked by the Federal Reserve by asset size, failed. On a combined basis, these three banks would have had assets of $532 billion as of 12/31/22, which would have ranked as the eighth largest U.S. bank ahead of Goldman Sachs ($487 billion in assets).
5Federal Reserve dot plot from 12/13/23, Bloomberg <WIRP> page 12/29/23
6The FOMC “dot plot” reflects the expectations of the members of the Federal Open Market Committee with respect to interest rates over the next several years. In the graph above, we assumed that the 75-basis point decline in rates in 2024 implied by the majority of FOMC members would be effected via three 25 basis point reductions taking place at the March, June, and December Federal Reserve meetings. This is in keeping with the Fed’s effort to appear apolitical by avoiding policy changes in the months just prior to a Presidential election.
7Bloomberg
8Of course, if the yield for maturities longer than 3 years rose substantially, in excess of 150 basis points, the curve would also be upward sloping, a really bad outcome for those investors extending duration.
9The “real rate of interest” is the difference between a nominal interest rate and the inflation rate.
10The option-adjusted spread (OAS) is the difference between a fixed-income security’s yield-to-worst and the risk-free rate of return, typically the yield of a U.S. Treasury bond with similar maturity, adjusted for the embedded option for the security’s issuer to call or prepay the instrument. In the graph, the Bloomberg Baa Corporate Total Return Index is used as a proxy for the investment grade market and the Bloomberg US Corporate HY Index is used as a proxy for the high yield market. | 10- Year Treasury Term Premium from Clarksons. Bloomberg US Corporate HY Index and Bloomberg Baa Corporate Total Return Index. Includes monthly data from 3/31/94 through 12/31/23.
11The primary risks in a long-term U.S. Treasury bond are market volatility and inflation which would cause a loss of purchasing power for holders of fixed rate bonds.
12Gallup, Mehlman Consulting, Federal Reserve Bank of St. Louis. Includes quarterly data from 1Q09 through 3Q23.
13Clarksons, Federal Reserve Bank of St. Louis. Includes monthly data from 11/1/48 through 10/1/23.
14The Sahm Rule Indicator identifies the start of a recession as the point at which the three-month moving average unemployment rate rises 0.5% or more above the lowest unemployment rate for the last 12 months.
15Bloomberg, ICE BofA Corporate Bond Index and ICI Money Market Fund Asset Index from 1/31/94 to 12/29/23.
16“European Materials Company” and internal. Name of the issuer is withheld as it is a private company. As of 9/30/23, our position in the company’s incumbent bond represented 2.02% of the CrossingBridge Low Duration High Yield Fund and 5.48% of the CrossingBridge Responsible Credit Fund. During the quarter that bond was refinanced through the issuance of a new bond, holdings of which, at 12/29/23, represented 2.37% of the CrossingBridge Low Duration High Yield Fund, 3.55% of the CrossingBridge Responsible Credit Fund, 2.44% of the CrossingBridge Low Duration High Income Fund, and 2.47% of the RiverPark Strategic Income Fund.
17GS Supply Chain Congestion Scale, Jan 2nd, 2024, Goldman Sachs, January 2, 2024
18At 3Q23, net leverage was 1.0x. If EBITDA were to drop to the 2019 level, net leverage would rise to 3.4x, but this would still be better than the 5.0x net leverage in 2019.
19At 9/30/23, none of our funds held positions in bonds of Tapestry/Coach. As 12/29/23, holdings in the Tapestry 7.05% Senior Notes due 6/21/24 represented 1.64% of the CrossingBridge Low Duration High Yield Fund, 2.07% of the CrossingBridge Ultra-Short Duration Fund, and 1.62% of the CrossingBridge Low Duration High Income Fund.
20At 9/30/23, holdings in the Warnermedia Holdings 5.05% Senior Notes due 3/15/42 represented 0.46% of the RiverPark Strategic Income Fund. On 12/29/23, the Warnermedia Holdings 3.428% Senior Notes due 3/15/24 represented 1.69% of the CrossingBridge Ultra-Short Duration Fund and 1.86% of the CrossingBridge Low Duration High Income Fund. On 12/29/23, the Warnermedia Holdings 6.412% Senior Notes due 3/15/26 represented 0.08% of the CrossingBridge Low Duration High Yield Fund and 0.08% of the CrossingBridge Low Duration High Income Fund.
21Aggregate holdings in Commercial Mortgage-Backed Securities (CMBS) as of 9/30/23 were 4.73% in the RiverPark Strategic Income Fund, 4.12% in the CrossingBridge Low Duration High Yield Fund, 2.12% in the CrossingBridge Responsible Credit Fund, and 10.51% in the CrossingBridge Ultra-Short Duration Fund. Aggregate holdings in CMBS as of 12/29/23 were 5.71% in the RiverPark Strategic Income Fund, 5.58% in the CrossingBridge Low Duration High Yield Fund, 2.12% in the CrossingBridge Responsible Credit Fund, and 11.39% in the CrossingBridge Ultra-Short Duration Fund.
22At 9/30/23, holdings in the Clear Channel International BV 6.625% Secured Notes due 8/1/25 represented 1.17% of the RiverPark Strategic Income Fund, 1.46% of the CrossingBridge Low Duration High Yield Fund, and 2.00% of the CrossingBridge Responsible Credit Fund. At 12/29/23, holdings in this bond represented 1.22% of the RiverPark Strategic Income Fund, 1.36% in the CrossingBridge Low Duration High Yield Fund, 1.78% in the CrossingBridge Responsible Credit Fund, and 1.41% of the CrossingBridge Low Duration High Income Fund.
23As of 9/30/23, our position in the NGL Energy 6.125% Senior Notes represented 2.49% of the CrossingBridge Ultra-Short Duration Fund. As of 12/29/23, our position in this bond represented 2.38% of the CrossingBridge Ultra-Short Duration Fund. As of 9/30/23, our position in the NGL Energy 7.50% Senior Secured Notes due 2/1/26 represented 1.41% of the CrossingBridge Low Duration High Yield Fund and 1.16% of the RiverPark Strategic Income Fund. As of 12/29/23, our position in this bond represented 1.37% of the CrossingBridge Low Duration High Yield Fund, 1.20% of the RiverPark Strategic Income Fund and 0.96% of the CrossingBridge Low Duration High Income Fund. As of 9/30/23, our position in the NGL Energy Series B Preferred Stock represented 0.43% of the CrossingBridge Responsible Credit Fund and 0.33% of the RiverPark Strategic Income Fund. As of 12/29/23, our position in these preferred shares represented 0.42% of the CrossingBridge Responsible Credit Fund and 0.36% of the RiverPark Strategic Income Fund.
24On 9/30/23, our position in the Chobani LLC First Lien Term Loan due 10/23/27 represented 1.26% of the RiverPark Strategic Income Fund, 0.41% of the CrossingBridge Low Duration High Yield Fund, and 1.79% of CrossingBridge Responsible Credit Fund. On 12/29/23, our position in this loan represented 1.25% of the RiverPark Strategic Income Fund, 0.38% of the CrossingBridge Low Duration High Yield Fund, and 1.60% of the CrossingBridge Responsible Credit Fund. On 9/30/23, we had no holdings in the Chobani LLC First Lien Term Loan due 10/25/27. On 12/29/23, holdings in this loan represented 0.76% of the RiverPark Strategic Income Fund and 2.21% of the CrossingBridge Responsible Credit Fund. On 9/30/23, holdings in the Chobani LLC 7.50% Senior Unsecured Notes due 4/15/25 represented 1.05% of the CrossingBridge Low Duration High Yield Fund and 0.37% of the CrossingBridge Ultra-Short Duration Fund. On 12/29/23, holdings in this bond represented 1.26% of the RiverPark Strategic Income Fund, 2.01% of the CrossingBridge Low Duration High Yield Fund, 0.61% of the CrossingBridge Responsible Credit Fund, 2.41% of the CrossingBridge Ultra-Short Duration Fund, and 2.34% of the CrossingBridge Low Duration High Income Fund.
25On 9/30/23, we had no holdings in the HMH Holdings BV 9.875% Secured Notes due 11/16/26. On 12/29/23, holdings in this bond represented 1.92% of the CrossingBridge Low Duration High Yield Fund and 2.29% of the CrossingBridge Low Duration High Income Fund.
26On 9/30/23, holdings in the Infrabuild Australia 12% Secured Notes due 10/1/24 represented 2.62% of the RiverPark Strategic Income Fund, 3.51% of the CrossingBridge Low Duration High Yield Fund and 3.37% of the CrossingBridge Responsible Credit Fund. During the quarter, this bond was repaid with proceeds of a new bond issue, so we had no holdings in this bond at 12/29/23. Issued during 4Q23, holdings in the Infrabuild Australia 14.5% Secured Notes due 11/15/28 represented, on 12/29/23, 2.79% of the RiverPark Strategic Income Fund, 1.49% of the CrossingBridge Low Duration High Yield Fund, 3.52% of the CrossingBridge Responsible Credit Fund, and 1.47% of the CrossingBridge Low Duration High Income Fund.
27On 9/30/23, holdings in the Stockwik Forvaltning Secured Floating Rate Note due 3/20/26 represented 0.65% of the RiverPark Strategic Income Fund, 0.64% of the CrossingBridge Low Duration High Yield Fund, and 2.73% of the CrossingBridge Responsible Credit Fund. On 12/29/23, holdings in these notes represented 1.01% of the RiverPark Strategic Income Fund, 0.94% of the CrossingBridge Low Duration High Yield Fund, 2.64% of the CrossingBridge Responsible Credit Fund, and 0.22% of the CrossingBridge Low Duration High Income Fund.
28On 9/30/23, holdings in the Icahn Enterprises 4.75% Senior Notes due 9/15/24 represented 0.55% of the RiverPark Strategic Income Fund, 0.53% of the CrossingBridge Low Duration High Yield Fund, 0.38% of the CrossingBridge Responsible Credit Fund and 1.79% of the CrossingBridge Ultra-Short Duration Fund. On 12/29/23, holdings in this bond represented 0.64% of the RiverPark Strategic Income Fund, 1.58% of the CrossingBridge Low Duration High Yield Fund, 0.46% of the CrossingBridge Responsible Credit Fund, 1.79% of the CrossingBridge Ultra-Short Duration Fund, and 1.87% of the CrossingBridge Low Duration High Income Fund. On 9/30/23, holdings in the Icahn Enterprises 6.375% Senior Notes due 12/15/25 represented 1.26% of the RiverPark Strategic Income Fund, 1.26% of the CrossingBridge Low Duration High Yield Fund and 1.26% of the CrossingBridge Responsible Credit Fund. On 12/29/23, holdings in this bond represented 0.99% of the RiverPark Strategic Income Fund and 1.04% of the CrossingBridge Low Duration High Yield Fund.
29Security Analysis, Seventh Edition, by Benjamin Graham and David L. Dodd, edited by Seth Klarman (2023)
30Written by Steven Romick