
“Tapping the market” sounds harmless enough—like turning on a faucet for a quick splash of liquidity.
![]()
Tap
“Tapping the market” sounds harmless enough—like turning on a faucet for a quick splash of liquidity. In Norwegian, though, å tape (pronounced like “tap”) means “loss” or “defeat,” and any bondholder who has experienced a Nordic bond tap knows the language is uncomfortably honest. Over the last five years, nearly all new issues in the Nordic corporate bond market included provisions that permitted the issuer to sell more of the same bond.1 Typically, to induce buyers to participate, the add-on bonds are offered at a discount to the market price. Companies call it “flexibility” but it’s often an immediate mark-to-market å tape —a loss2—for existing lenders.3
CrossingBridge Funds vs Peer Group for 5 Years4
(Period ending December 31, 2025)

Because we invest in Nordic corporate bonds, we see taps all the time5 and understand both its utility and its sting. But CrossingBridge remains, first and foremost, a bottom-up value credit investor whose core strength is downside risk management, substantiated by the table above (shamelessly self-promoting). Whether it’s a Nordic issuer tapping or a U.S. company availing itself of a hot market, the principle is the same: raising capital is easy (except when it isn’t…LOL); protecting capital is hard. Our job is not to cheer every tap, but to sidestep the ones that turn a temporary price concession into a permanent loss.
U.S. Market & Policy Amplitude Timeline (1825-2026)6
200 Years of Economic Transformation – Normalized Scale (Base 3.0 = 0)
Normalized Amplitude: 0 – Base Stability (Raw 3.0), 10 = Maximum Crisis (Raw 9.5+)

(The 35 observable periods are identified in chronological order in Appendix A)
On Tap - Many economic, technological, geopolitical, and policy-changing events are occurring in rapid fire and will continue. This has significant implications. Thus, much is “on tap” in the coming year. The graph above, which we created using a proprietary method via Claude (artificial intelligence) employs a composite index, normalized to a 0-10 scale, of the magnitude of economic, policy and market factors across 200 years to rank 35 periods of significant disruption.7 The period of the Trump presidency 2.0 (bar AI above), in 2025-26, represents the seventh most disruptive period only exceeded by, in order beginning with the most disruptive period, the Great Depression (M), World War II (O), the Civil War (D), the 2008 Global Financial Crisis (AC), the COVID-19 Pandemic (AF), and the Panic of 1873 (E).
Aside from the high level of disruption we are experiencing, there are several observations that can be drawn from the analysis:
- Inequality matters more than previously recognized. All of the top five periods had very high scores for inequality. Coupling high inequality with another shock has led to system crisis.
- Technology disruption alone does not drive amplitude. There have been periods of high technological change that coincide with environments of both high and low overall disruption (e.g. the Civil War and the technology boom of the late 1990s, respectively).
- The current period has an unprecedented combination of high levels of disruption including the technological revolution in artificial intelligence, extreme inequality, policy chaos and geopolitical tensions. No period before has combined these four factors at such elevated levels.
- THE critical factor in elevating the current environment to one of crisis is liquidity in the market and the availability of credit. The Great Depression, World War II, the Civil War and the Panic of 1873 all featured credit/banking crises.
At present, the current period is the only one of high disruption in which the financial markets were not in turmoil. Simply put, if credit markets remain healthy, we may see high dispersion, but volatility will be manageable. If the credit market breaks, the current environment may become the #2 or #3 crisis in the last 200 years. The President is often derided for backing away from extreme policy positions with this behavior called TACO, an acronym for “Trump Always Chickens Out”. Giving him the greatest benefit of the doubt and a more positive spin, this may be only a negotiating tactic: putting up “trial balloons”, far beyond his hoped-for outcome, then backing away to a position acceptable to the other side yet sufficient to equal or exceed his true goals. Notwithstanding the extreme rhetoric and sharp shifts in fiscal, trade, and social policy brought on by the Trump administration, we are optimistic that Treasury Secretary Bessent and other key leaders are cognizant that faith in the banking system and credit markets is critical and they will prevent the country from being pushed to the brink.
Below, we discuss the themes most relevant to the markets in which we invest and provide insight into the approach we will take in 2026.

Opening the Tap – When asked in an interview with the Wall Street Journal where he wants interest rates to be a year from now, President Trump9 said “1% and maybe lower than that”.10 By “opening the tap” he hopes to stimulate the economy, improve housing affordability11 and reduce the cost of servicing the Federal deficit. As three 25-basis point (bp) reductions in the Fed Funds Rate during 2025 have already caused the short end of the yield curve to fall dramatically, as shown above. However, the long end of the curve, reflecting the expectations for sustained inflation, has remained high, resulting in a “bull steepener”.12 Further reduction in short-term rates may lead to an overheating economy, rising inflation and further devaluation of the U.S. dollar. For fixed income investors, the reduction in short-term rates has already reduced the yield they can expect to earn via money market funds from above 5.0% to about 3.5%. If 3.5% doesn’t excite you much, you will need to explore alternatives. Anticipating further rate cuts, some may be inclined to extend duration as a tactical strategy for which the outcome is unknowable today. For instance, should inflation rise and/or the dollar devalue further, which would be our hunch barring a deep recession, long-term rates are likely to follow, resulting in a bear steepener13 which would lead to mark-to-market losses on intermediate and longer maturity portfolios. Rather than speculate on rate movements, we choose to focus on things we can actually measure, such as working capital, cash flows, and leverage.
Investment Grade Credit Spreads14

The Tap Runneth Dry? – Demand for capital over the next ten years is likely to put a strain on global markets, begging the question: “Will the cost of borrowing just be higher in the future or will the debt market just be tapped out?” For example artificial intelligence (AI) infrastructure global spending, is estimated to aggregate up to $7 trillion by 2030.15 We are early in the “AI revolution”, but have already seen a significant increase in debt issuance by hyperscalers to fund the buildout.16 In 2025, hyperscalers issued approximately $120 billion of high-grade bonds, approximately seven times the amount they issued in the prior year.17 As reflected in the graph above, the credit markets are expressing growing skepticism, requiring an increasing premium for debt issued by hyperscalers while credit spreads for investment grade industrial companies decline. We are not questioning the tremendous advances from AI, but rather, the return on capital. The spate of telecom defaults in the early 2000s, the 2008 real estate crisis, and the fracking bust of 2015-16 are examples in recent memory of markets running to excess, fueled by heightened leverage and leading to lender losses. Further, AI is just one of several technological revolutions taking place now – think space, quantum computing, etc. – that will also have large capital needs. More broadly, this will coincide with expansion of the U.S. federal deficit, projected to grow by $7.9 trillion by 2035,18 and funding needs to meet several large international initiatives including renewed European defense spending (over €800 bn),19 the rebuilding of Venezuela’s oil infrastructure ($180-200 billion),20 and reconstruction of Ukraine ($524 billion)21and Gaza ($70 billion).22 In aggregate, it’s a helluva lot of money. After the Berlin Wall fell in 1989, 10-year bund rates rose by 190 bp over the following 11 months as Germans drew down their savings and then borrowed heavily to finance the reunification of East and West Germany. Rates rose in parallel in the U.S., UK, and Japan,23 ultimately leading to recession in Western Europe. Given the significant global capital needs, many would-be borrowers will be “crowded out” as “Mr. Market” demands higher real returns24 on capital and term premium rises.25
Default Rates26

Tapping Out – Unlike the high yield and leveraged loan markets, where default rates have remained relatively stable, defaults in the direct lending market have risen sharply, as shown above. This trend has forced many private equity sponsors to “tap out,” surrendering equity to lenders through restructurings. In the first half of 2025 alone, sponsors transferred equity tied to $21 billion of debt—more than the combined total of similar cases from 2019 through 2024.27 We expect this pattern to persist into 2026, as the growing prevalence of “bad PIK” debt28 signals further financial strain. PIK instruments represent 11% of the universe of direct loans tracked by Lincoln International. Of those, over half now qualify as “bad PIK”—loans originally paying cash interest but now paying their coupons in additional debt.29 Stress is further evident in loan-to-value ratios, which have climbed from 45% at issuance to 83%30 for these troubled credits. In contrast, J.P. Morgan projects a relatively benign outlook for traded leveraged debt: high yield bond defaults are expected to run at roughly two-thirds of the 25-year average, while leveraged loan defaults should remain near historic norms.31 Taken together, this points to a stable environment for public credit markets, even as private credit faces mounting pressure.
Distressed Transactions32
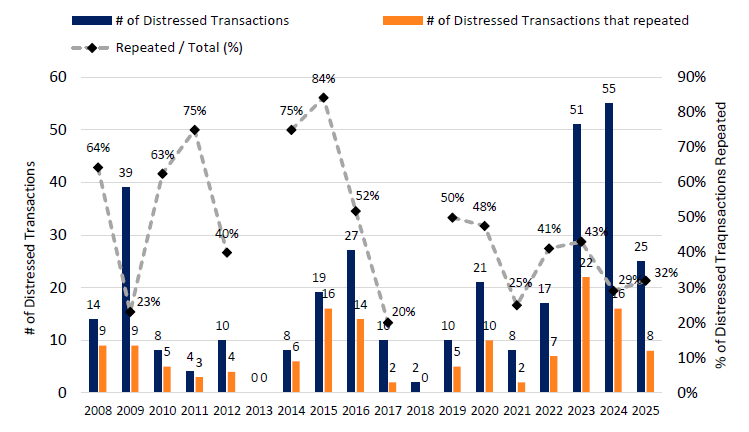
Double Tap - Distressed exchanges (DEs) and liability management exercises (LMEs) have become much more prevalent as methods for dealing with distressed credits – thanks to the dominance of collateralized loan obligation vehicles in the loan market for enabling a new wave of “zombies”. 33Often these financial restructurings leave the companies still overleveraged but do not address the underlying problems, ultimately leading to second round of restructuring. In the graph above, 40% of companies going through out-of-court restructurings from 2008 through 2025 have experienced a second bout of distress.34 We regularly evaluate debt opportunities issued upon completion of DEs and LMEs as they often have above-market yields and more stringent lender protections. However, we also maintain a high degree of skepticism as out-of-court restructurings are often exercises in “kicking the can down the road”. Notably, through our experience in investing in leverage credit in the Nordic markets, we have learned that, in several countries, company directors become personally liable if a borrower does not meet regulatory capital requirements. As a result, it is rare that a restructuring in these markets does not significantly reduce leverage.
Portion of Low-Quality Credit in the
High Yield and Leveraged Loan Markets35

Tapping the Brakes – We are “tapping the brakes” on leveraged loans, slowing our activity in that market in favor of fixed rate bonds and Nordic debt. J.P. Morgan’s projection for the 2026 leveraged loan default rate at 3.0% is elevated relative to that for high yield bonds at 1.75%.36 As suggested in the graph above, this is largely because the leveraged loan market has a significantly higher concentration of lower quality instruments than the high yield bond market. This is but one of the factors in a “triple whammy” that might cause the leveraged loan market to underperform. The second is the fact that the coupon that can be earned on loans, which are typically floating rate instruments, will decline if the Fed continues to reduce interest rates, as discussed above. Lastly, historically narrow credit spreads37will also reduce the attractiveness of leveraged loans. In contrast, for fixed rate high yield bonds, a decline in interest rates would partly offset the negative impact of widening credit spreads that would likely result from a downturn in the credit cycle, limiting price volatility relative to loans.
DIPs Can Trip You Up38

Tap Dancing – Investment in debtor-in-possession (DIP) financings39 can provide significantly higher returns than basic high yield bonds or leveraged loans, but one must tap dance through this market, stepping carefully so as not to get tripped up. In today’s market, the typical DIP financing has a floating rate coupon of 10-15%, pays lenders a commitment fee (often in the form of issuance at a price below par) of 2-5 points, and may have an exit fee of an additional 2-5 points. If the DIP loan is repaid in cash after one year, it should have a yield ranging from the low teens to the mid-20s. Given that they typically have priority liens over all other creditors, DIP loans are highly likely to be repaid when the company exits Chapter 11.
However, the rules still apply with respect to solid credit analysis and careful reading of documentation; failure in this discipline may lead to losses. By way of example, the two DIP financings shown above looked pretty “juicy” when they were issued in late 2025, but the distress that led to Chapter 11 has intensified. As such, the First Brands’ “new money” DIP noted in the table above was bid at a price of 18 on January 15, 2026, and, on the same date, the Kloeckner Pentaplast DIP was bid at 90. First Brands, which we discussed in our 3Q25 investor letter, has turned out to be even worse than expected with unusually high working capital needs and allegations of management fraud. The company is rapidly burning through cash and is expected to sell off assets, but their value is a big question and recovery for DIP lenders is uncertain. Kloeckner Pentaplast’s operating performance has been disappointing, leading the company’s equity sponsor, who was expected to fund an out-of-court restructuring, to walk away, leaving a Chapter 11 filing as the company’s only option.40 Whereas initial expectations were that the DIP would be repaid in cash at the end of the bankruptcy, it now appears that it will remain in place as exit financing. It appears that the DIP loan is trading below par based on investors’ assessment that leverage will remain high after emerging from bankruptcy, above 5.0x earnings before interest, taxes, depreciation and amortization (EBITDA), and an expectation that the company may need to PIK a portion of the coupon (i.e. pay with additional debt in lieu of cash) to maintain liquidity.
On the other hand, here is a DIP financing we like…
Marelli North America, Inc. (MANOAM) SOFR + 800 bp, $865 Million Tranche A DIP Facility due 202641 - Marelli North America, Inc. is the U.S. filing entity of Marelli Holdings Co. Ltd., a Japanese-based tier-1 global auto components supplier formed through KKR’s 2019 merger of Calsonic Kansei and Magneti Marelli. The company supplies more than sixty-five original equipment manufacturers including Stellantis, Nissan, Volkswagen, BMW, and Mercedes. A prolonged stretch of operational underperformance left Marelli unable to meet working capital needs and other funding obligations. This ultimately resulted in a June 2025 Chapter 11 filing in Delaware for select U.S. entities, parallel to the restructuring process in Japan. At filing, Marelli carried more than ¥700 billion of senior and emergency loans (roughly $5 billion USD), and the U.S. estate required immediate liquidity to fund payroll, suppliers, and stabilize production.
The Tranche A DIP was born of a months-long stalemate between Japanese and U.S. lender groups and represents a rare example of a true third-party, new-money, priming facility in a large, complex restructuring. Cultural and process constraints among the Japanese banks made a consensual, lender-led financing solution effectively unattainable, necessitating an external source of capital. The $865 million loan pays a cash coupon of SOFR + 800 bp, which steps up by 100 bp if the maturity date is extended from March to June 2026, was issued at 99.50, and includes a 2.0% cash exit fee. We believe the loan is covered with an adequate margin of safety as a detailed sum-of-the-parts analysis indicates greater than 2x asset coverage and DIP-level leverage of approximately 2.5-3.5x normalized EBITDA. In addition, the covenants are especially strong, including a requirement for 100% lender consent to incur additional indebtedness and a mechanism that allows lenders to be taken out at par if they elect not to participate in any incremental funding, eliminating the risk of being “tapped” at below-market pricing. Moreover, the Restructuring Support Agreement requires repayment of the DIP in full in cash, and lenders cannot be forced into a takeback exit facility, significantly reducing reliance on the ultimate business plan. We began building our position in the Tranche A DIP at prices around 102, which would generate an approximately 12.5% yield even if the Plan of Reorganization is not consummated until the extended June 2026 maturity.
Tapping In – It is rare that an investment goes in a straight line, as expected, from purchase to exit. When things do not go as planned and the market price for a security begins to decline, we may need to tap in a bit more intensely to find out what’s really going on with a credit. Are we seeing a decline in operating performance that may lead to a loss of principal or does the market misunderstand what is going on? If we conclude that a price decline is signaling increased likelihood of permanent impairment, we will often look to sell. However, as shown in the examples below, investments that experience mark-to-market declines that are viewed as not permanent should be maintained or added to opportunistically.
Bally’s Corporation (BALY) SOFR + 325 Senior Secured Term Loan B due 202842 - In our 2Q25 investor letter, we detailed our investment in Bally’s Corporation Term Loan B due 2028, an event-driven opportunity in which we expected early repayment from proceeds of the sale of the company’s Intralot operation. Following the sale of Intralot in October 2025, Bally’s applied only a portion of the sale proceeds to the Term Loan B. It invested part of the balance in its Chicago casino development and held the remainder in a contingency reserve in case it was awarded a license to operate a casino in New York. This surprised the market and drove the Term Loan B from a high of 99.50 to a low of 90.00. Seeking to further improve liquidity, the company proposed a partial paydown and modestly increased economics in exchange for lender consent to use the proceeds of the sale-leaseback of its Twin River asset for development. At this point, CrossingBridge became highly engaged with other term lenders and participated in a steering committee that entered into direct discussions with management. Seeking greater de-leveraging and stronger collateral and covenant protections, the term lender group rejected the company’s proposal, resulting in a temporary impasse within the syndicate and heightened price volatility. Further analysis of the value of the company’s assets gave us the confidence to increase our position in the loan at prices in the low 90s. In December, Bally’s won one of three New York casino licenses43and announced a refinancing that will repay the existing Term Loan B in full in 1Q26 while providing incremental capital for development. With refinancing risk removed, the Term Loan B has rebounded to a price around 99, validating the event-driven nature of the opportunity and our decision to add during the dislocation. Based on purchase prices between 90.63 and 95.75, we expect to realize an approximate 21.0% rate of return on our incremental purchases, assuming the refinancing closes by the end of 1Q26.44
Grubhub Holdings, Inc. (GRUB) 13.00% Senior Secured Notes due 203045 - Grubhub is a leading U.S. food delivery marketplace with a national network serving over 400,000 merchants and a large installed base of repeat customers. We originally invested in Grubhub’s 5.500% Senior Notes due 2027 in early 2024 following the announced acquisition of the company by Wonder Group, Inc. When the transaction did not trigger a change of control, yield-to-call investors exited and the bonds sold off, providing us with an opportunistic entry point. As part of an ad hoc bondholder group, we participated in August 2025 refinancing of the 5.5% bonds via issuance of new 13.00% senior secured notes due 2030. These bonds have first-priority liens on substantially all material assets, strong covenant protections, and structural seniority to the Wonder-provided liquidity facilities. In early November, the new notes traded down sharply to a low of 75 amid investor concerns that Wonder’s growth strategy would pressure near term EBITDA. It was our view that this price action reflected a misunderstanding of a temporary increase in discretionary marketing investment flowing through the income statement, rather than any deterioration in the underlying business fundamentals. At the time that Wonder acquired the company, Grubhub had modest leverage and generated positive free cash flow.46 Results in 2Q25 and 3Q25 provided early evidence that targeted growth investments were leading to more stable volumes, particularly in New York City. We believe Grubhub has ample liquidity to fund its investment cycle through subordinated facilities and cost savings from workforce reductions and that cash flow should improve as the company benefits from recent legislation providing relief in New York City from delivery fee caps. Improved corporate disclosures highlighting core EBITDA and cash flow generation, excluding growth spending, should further assist in assuaging investor concerns. Despite the volatility in bond prices, we did not reduce our position. Rather, we remain confident that, on a normalized basis, core cash flows and asset coverage provide a substantial margin of safety for the senior secured notes.
Orexo AB (ORXSS) STIB + 650 Secured Notes due 202847 - Orexo is a Swedish-listed pharmaceutical company with a broad R&D pipeline and one patent-protected commercial product (Zubsolv) that generates the majority of its revenues and profits. The 2028 floating rate secured note was issued in 2024 when the company, on a group level, was not generating free cash flow as cash flow generated from Zubsolv sales were being used to fund R&D. Although we were cognizant of high regulatory risks inherent in the drug development and approval processes, we participated in the bond issuance based on our confidence that the entity which owned Zubsolv guaranteed the bond and should provide sufficient asset protection even if the rest of the pipeline failed to materialize. By early 2025, it became apparent that Orexo’s next drug launch would be significantly delayed due to unexpected FDA feedback, broader regulatory uncertainty, and the U.S. government shutdown. Negative cash flow resulting from these delays, in addition to R&D spending that exceeded expectations, led to dwindling liquidity, bringing the company close to a covenant breach. The heightened uncertainty caused the price of the bond to decline to the low 90s. Despite these developments, we maintained our exposure as we had not uncovered any facts that changed our core thesis. On December 22, 2025, the company announced the sale of the U.S. rights to Zubsolv for approximately $100 mm or about double the amount of bonds outstanding. In conjunction with the transaction, Orexo announced plans to fully redeem the bond during 1Q26, likely at the make-whole price, resulting in a total return in excess of 10%.

Tap-Ins – In golf, a tap-in results when one does everything right: a good drive, followed by an accurate approach shot that lands on the green, then a putt that leaves the ball near the cup for an easy tap-in for par. Good credit investing is similar: It begins with a good company with stable cash flows, a credit document that provides acceptable creditor protections and a market price that reflects appropriate pricing for the risk. As we end 2025, most asset classes seem expensive, and we continue to focus our portfolio management process on prioritizing downside risk-management and being very selective in choosing credit opportunities in which to participate. This is not an environment to take a big swing and try to drive the green on every hole. We are happy to stay patient and take the safe shots that lead to predictable outcomes – investments that have a margin of safety where we are paid for the risk we are taking.
Mutual Fund Selected Characteristics 12/31/2548

Playing "Taps" ...Let's call it a wrap
"Day is done, gone the sun, from the hills, from the sky. All is well, safely rest. God is nigh."49

David K. Sherman and the CrossingBridge Team
Appendix A – Key to U.S. Market & Policy Amplitude Timeline
| Code | Period | Years | Defining Characteristics |
|------|--------|-------|-------------------------|
| A | Jacksonian Era & Bank Wars | 1825-1836 | Second Bank fight, speculation |
| B | Panic of 1837 & Depression | 1837-1843 | Banking crisis, credit collapse |
| C | Antebellum Expansion | 1844-1860 | Manifest Destiny, railroad growth |
| D | Civil War & Reconstruction | 1861-1877 | National crisis, transformation |
| E | Panic of 1873 & Long Depression | 1873-1879 | Railroad bubble, bank failures |
| F | Post-Depression Expansion | 1879-1889 | Recovery, industrial growth |
| G | Gilded Age Crisis | 1890-1896 | Silver panic, labor unrest |
| H | Progressive Era Stability | 1897-1913 | Reform, trust-busting |
| I | World War I | 1914-1918 | War mobilization |
| J | Post-War Adjustment | 1919-1920 | Inflation spike, recession |
| K | Return to Normalcy | 1921-1924 | Stabilization, Harding/Coolidge |
| L | Roaring Twenties Peak | 1925-1928 | Speculation, innovation boom |
| M | Great Depression & Banking Crisis | 1929-1933 | Worst crisis in US history |
| N | New Deal Recovery | 1934-1940 | Government intervention |
| O | World War II Mobilization | 1941-1945 | Total war economy |
| P | Post-War Transition | 1946-1952 | Demobilization, Cold War |
| Q | Eisenhower Stability | 1953-1960 | Consensus, prosperity |
| R | New Frontier | 1961-1963 | Space race, Cuban crisis |
| S | Great Society Peak | 1964-1967 | Lowest amplitude period |
| T | Vietnam & Stagflation Onset | 1968-1974 | Social unrest, inflation |
| U | Stagflation Peak | 1975-1979 | Oil shocks, malaise |
| V | Volcker Shock | 1980-1982 | Rate spike, recession |
| W | Reagan Bull Market | 1983-1987 | Tax cuts, defense spending |
| X | Black Monday & Recovery | 1987-1989 | Crash then rebound |
| Y | Gulf War & Mild Recession | 1990-1994 | S&L crisis resolution |
| Z | Great Moderation Peak | 1995-1999 | Tech boom, low inflation |
| AA | Dot Com Crash & 9/11 | 2000-2002 | Bubble burst, terrorism |
| AB | Housing Boom | 2003-2006 | Credit expansion |
| AC | Global Financial Crisis | 2007-2009 | Credit freeze |
| AD | Post-Crisis Recovery | 2010-2015 | QE, slow growth |
| AE | Trump 1.0 Era | 2016-2019 | Tax cuts, trade wars |
| AF | COVID-19 Pandemic | 2020 | Lockdowns, stimulus |
| AG | Inflation Surge | 2021-2022 | Supply chains, rate hikes |
| AH | AI Boom & Disinflation | 2023-2024 | Tech rally, soft landing |
| AI | Trump 2.0 & AI Transformation | 2025-2026 | Policy chaos, tech disruption |
Endnotes:
1 ABG Sundial Collier
2 Ibid. According to ABG Sundial Collier, in 95 of 147 instances for which pricing data is available since 2021, the price of the pre-existing bond declined after a tap issuance in comparison to the market price 6-8 days prior to the add-on financing.
3 Similarly, U.S. leverage loans often have uncommitted “accordion” features which permit the issuer to incur additional pari passu debt without requiring lender consent. In 2025, there were 605 new leveraged loan issuances totaling just under $500 billion. Of these, 287, nearly half, employed the accordion provision to raise incremental term loans of approximately $122 billion. (per Jefferies LLC)
4 The Sharpe Ratio measures an investment’s risk-adjusted return by dividing total return, less the risk-free rate, by the standard deviation of the investment’s historic return. Downside Capture measures an investment’s relative performance in a down market by dividing a portfolio’s returns in down markets by returns of an appropriate index during the same periods.
5 According to Pareto Securities AS, taps comprised 22% of Nordic market high yield bond issues (by number) in 2025. In each year since 2019, they have accounted for 18-31% of bonds issues.
6 Created using a proprietary method via Claude (artificial intelligence) employing a composite index, normalized to a 0-10 scale, of the magnitude of economic, policy and market factors across 200 years to rank 35 periods of significant disruption. Methodology and factors available upon request.
7 Methodology and factors available upon request.
8 Yield curves per Bloomberg <GC I25> as of December 31, 2024, and December 31, 2025
9 Trump Says He is Leaning Toward Warsh or Hassett to Lead the Fed, Wall Street Journal, December 12, 2025
10 This may be another “trial balloon”.
11 We do not subscribe to this policy solution. We believe that the solution to housing affordability is an increase in supply.
12A bull steepener occurs when short-term interest rates fall faster than long-term rates, suggesting economic weakness and the potential for Fed rate cuts.
13 A bear steepener occurs when long-term rates rise faster than short term rates (or short-term rates decline), suggesting strong growth and higher inflation expectations.
14 Divergence Emerging Between Credit Spreads for Hyperscalers and Industrials, Apollo-The Daily Spark, January 21, 2026
15 The cost of compute: A $7 trillion race to scale data centers, McKinsey Quarterly, April 2025
16 Hyperscalers Changing Their Capital Structure, Apollo-The Daily Spark, January 23, 2026
17 AI Bonds Could Devour Credit Markets. Let Stock Investors Take the Risk, Barron’s January 15, 2026
18 Congressional Budget Office
19 White Paper for European Defence – Readiness 2030, European Commission, March 19, 2025
20 Spending over $100 billion to rebuild Venezuela’s oil industry won’t be the biggest obstacle facing U.S. oil companies, MarketWatch, January 5, 2026
21Updated damage assessment finds $524 billion needed for recovery in Ukraine over next decade, United Nations Development Programme, February 25, 2025
22 Gaza: $70 billion needed to rebuild shattered enclave, United Nations Development Programme, October 14, 2025
23 On November 9, 1989, the day the Berlin Wall fell, the 10-year bund yielded 7.22%. It peaked on September 28, 1990, at 9.13%. Over that same period, 10-year government bond rates in the U.S., UK, and Japan rose by 170 bp, 128 bp and 260 bp, respectively (Bloomberg data).
24 The real return is what is earned on an investment after accounting for taxes and inflation. It is, in part, a reflection of the supply and demand for capital.
25 Term premium is the extra yield investors demand for holding longer-term bonds versus shorter-term bonds to compensate them for interest rate volatility and inflation that may be experienced over the longer commitment period.
26 BofA Global Research and Lincoln Senior Debt Index Q3 2025, Lincoln International LLC, September 30, 2020, through September 30, 2025
27 Ibid.
28 Pay-in-kind (PIK) refers to the ability of an issuer to pay interest by issuing additional debt in lieu of paying cash. Bad PIK debt is debt that, at issuance, required payment of interest in cash, but has been amended to permit payment-in-kind due to the weakening ability of the issuer to service its debt because of declining cash flow.
29 The Lincoln Private Market Index Records Another Quarter of Growth in Q2, Lincoln International LLC, August 2025
30 Ibid.
31 Ibid.
32 2026 High Yield Bond and Leveraged Loan Outlook, J.P. Morgan, November 25, 2025
33According to the Bank for International Settlements, zombie companies are defined as non-financial companies that are over 10 years old and are unable to cover their interest expense from current operating income for three consecutive years. See our 2Q19 investor letter “Rise of the Living Dead”.
34Ibid.
35Default Outlook, J.P. Morgan, November 13, 2025. Data from January 1, 2000, through November 12, 2025
36 Ibid.
37Leveraged Loan Chartbook, Bank of America, January 2, 2026. Survey includes leveraged loan credit spreads for months ending In January 2010 through December 2025. Credit spreads for leveraged loans at 12/31/25 are in the 20th percentile for the asset class going back to January 2010.
38 First Brands and Klockner Pentaplast bankruptcy filings
39A DIP financing is a loan made to a company in Chapter 11 that provides the debtor with capital to fund operations and legal and restructuring fees while it is in bankruptcy. These loans typically have super-senior priority over all the company’s pre-petition creditors, making them first in line for repayment at the end of the bankruptcy process.
40On December 31, 2025, the Marelli North America, Inc. (MANOAM) SOFR + 800 bp, $865 Million Tranche A DIP Facility due 2026, represented 0.83% of the CrossingBridge Low Duration High Income Fund and 0.44% the CrossingBridge Ultra-Short Duration Fund.
41Another example of the private equity sponsor “tapping out”
42 On December 31, 2025, the Bally’s Corporation (BALY) SOFR + 325 Senior Secured Term Loan B due 2028, represented 2.37% of the CrossingBridge Low Duration High Income Fund, 2.26% of the RiverPark Strategic Income Fund, and 1.87% of the CrossingBridge Ultra-Short Duration Fund.
43 The New York State Gaming Board approved Bally’s casino license on December 1, 2025. To secure the license, Bally’s paid the state a one-time, non-refundable $500 mm license fee.
44 Discussed in our 2Q25 investor letter, our previous purchases of the Bally’s loan were at prices ranging from 97.50 to 98.75. If the loan is repaid by the end of 1Q26, those purchases, including repayments previously received, will achieve an internal rate of return of 10.5%.
45 On December 31, 2025, the Grubhub Holdings, Inc. (GRUB) 13.00% Senior Secured Notes due 2030, represented 2.36% of the CrossingBridge Low Duration High Income Fund, 2.26% of the RiverPark Strategic Income Fund, 1.95% of the CrossingBridge Responsible Credit Fund, and 0.75% of the CrossingBridge Ultra-Short Duration Fund.
46 Free cash flow is the cash a company generates after paying its operating expenses and capital expenditures.
47 On December 31, 2025, the Orexeo AB (ORXSS) STIB + 650 Secured Notes due 2028, represented 0.33% of the CrossingBridge Low Duration High Income Fund and 0.25% of the CrossingBridge Responsible Credit Fund.
48 Dry powder is defined as the sum of cash, cash equivalents, pre-merger SPACs, and maturities of 90 days or less.
49 “Taps” originated with the Union Army in 1862 during the American Civil War to signal lights out and time to go to sleep at day’s end and for funerals. The lyrics are attributed to Richard Hurd, a member of the Class of 1878 of the Pennsylvania Military College.
The Fund’s Subsidized/Unsubsidized SEC yields as of 12/31/25 were as follows:
CrossingBridge Low Duration High Income Fund (CBLDX): 6.55%/6.55%
CrossingBridge Low Duration High Income Fund (CBLVX): 6.27%/6.27%
CrossingBridge Ultra-Short Duration Fund (CBUDX): 4.17 %/4.21%
CrossingBridge Responsible Credit Fund (CBRDX): 8.11%/7.75%
RiverPark Strategic Income Fund (RSIIX): 7.64%/7.64%
RiverPark Strategic Income Fund (RSIVX): 7.38%/7.38%
Nordic High Income Bond Fund (NRDCX): 6.71%/6.56%