
Going Viral
COVID-19 has been immensely disruptive, impacting virtually every nation, every city, every neighborhood and every household socially, medically, mentally and economically. We hope that you and the people you care about are safe and healthy.
The economy was essentially “switched off” in unprecedented fashion. A significant portion of small and large businesses has been virtually closed with their revenues reduced to practically nothing. With the country locked down under “shelter in place” directives, we all wait to embrace a “new normal.” Meanwhile, individuals and business owners lay awake at night worrying if their financial resources will be enough to sustain them until they reach the light at the end of the tunnel.1
Defaults, Credit Losses and U.S. Unemployment Rate in Previous Cycles/Projected Scenarios
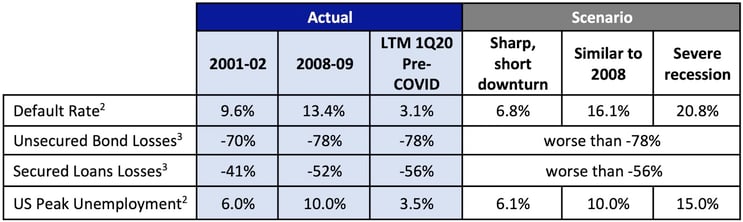
We have entered the unknown. As shown above, Moody’s2 estimated the depth of distress based on past episodes of widespread credit deterioration. Modeling three scenarios, they project the high yield default rate to range from 6.8% to 20.8%. For context, historical losses for unsecured bonds and secured loans is provided. Going forward, we believe that loan losses will be worse given the loose underwriting standards over the last several years. In this environment, weak companies that were being sustained by accommodative capital markets may finally meet their end via sale or liquidation. Over-levered companies with otherwise sound businesses may be restructured with lenders becoming equity owners. Good companies that have maintained reasonable balance sheets and have access to liquidity will survive and recover when we come out the other side. New capital that allows companies to reach the end of the tunnel to participate in normalization and future expansion is likely to be rewarded.
Reflection of 1Q20 Market Activity
As shown below, the financial markets experienced their sharpest quarterly decline since the Great Financial Crisis.4
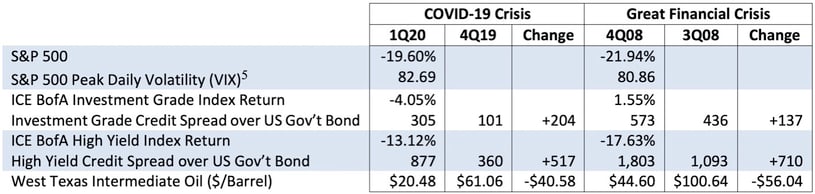
Clearly, we are now in a recession. The key questions are “How long will it last?” and “How fast can we come out of it?” Many economists forecast that unemployment rates will soar to levels rivaling the Great Depression.6 Thus, it is critical that people get back to work quickly and safely.
U.S. Oil Consumption7
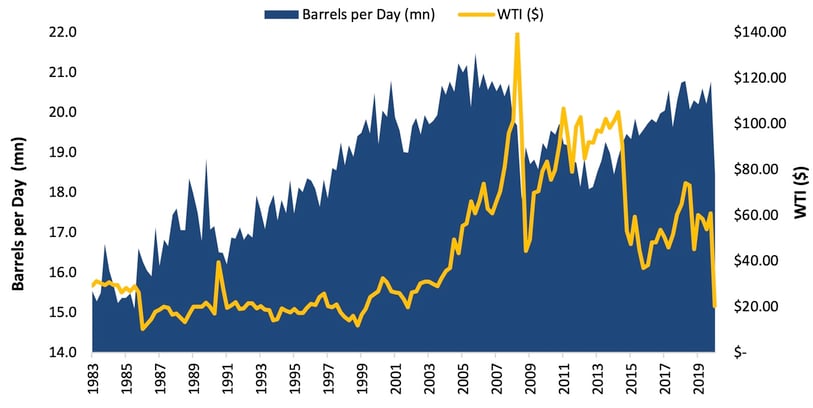
Not only was the quarter plagued by COVID-19, Russia and Saudi Arabia initiated an oil price war on March 9th. With few people leaving their homes, global oil demand is estimated to have declined from 100 million barrels per day (bpd) to 82 million;8 this factor alone would have caused a sharp decline in price. The price war was fueled by a 5 million bpd increase in production and Saudi-led price cuts.9 At year-end 2019, the WTI10 price was $61.06/barrel, but fell to $20.48/barrel as of the end of the quarter. The most significant drop, in mid-March, occurred virtually overnight following the OPEC+ meeting. At month-end February 2020, the energy weighting for the high yield market was 11.6% and similarly, for the investment grade market, it was 11.2%. During the month of March 2020, the high yield energy sector declined in excess of 33%11 while the investment grade energy sector declined 17.1%.12
BBB Par vs HY Par13
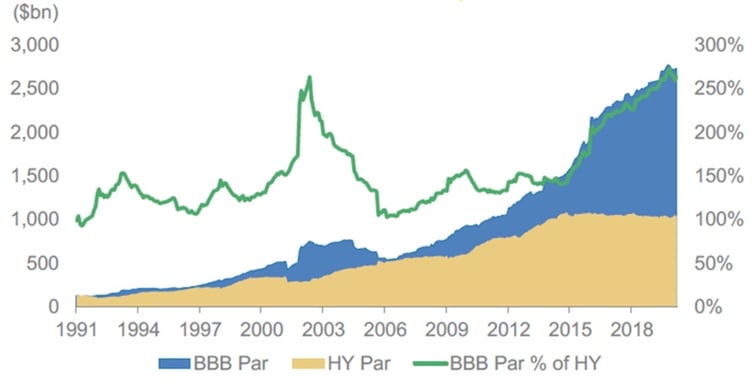
The wave of credit downgrades in March 2020 included an estimated $80 billion14 of “fallen angels”, credits downgraded from investment grade to high yield. Over the next six months, Goldman Sachs estimates that $550 billion of investment grade bonds will be downgraded to high yield,15 increasing the size of the high yield market by more than 50%. These downgrades encompass a broad range of industries: retailing, consumer products, auto, travel and energy. In our 2Q18 investor letter titled, “Float Like a Butterfly, Sting Like a (Triple) B”, we warned that the fixed income market was vulnerable to a rise in fallen angels due to the growing portion of the investment grade market that was rated BBB, the lowest investment grade rating. We also noted that, at that time, the universe of BBB bonds was 5.3x the size of the BB market, setting up the potential for significant widening of credit spreads in the event that a wave of downgrades led to a massive expansion of the high yield market that was difficult for investors to absorb.
Developed Markets (USD) High Yield Default Rate16
(% of issuers)
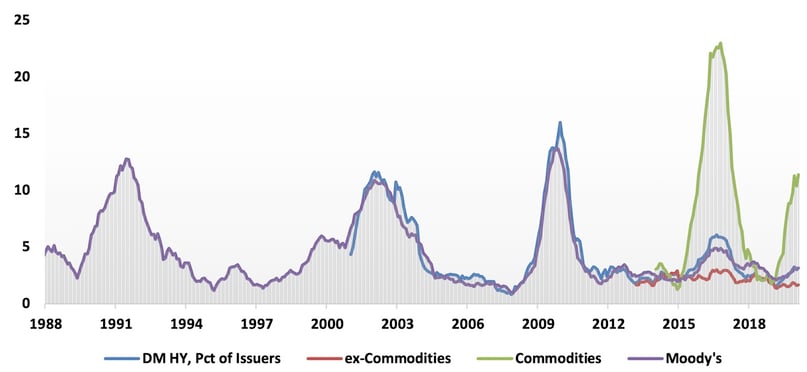
Naturally, in the course of any credit cycle, there is a rise in credit downgrades and a significant increase in debt trading at distressed levels.17 Typically, defaults rise, generally resulting in permanent impairments. As noted on our cover page, Moody’s is projecting the high yield default rate to reach at least 6.8% and possibly go as high as 20.8%. During the end of a credit cycle, prices swiftly decline for low quality investment grade and high yield bonds. Going forward, it will be important to determine which holdings have risk of further decline and/or permanent impairment and to rebalance the portfolio, opportunistically taking advantage of price declines to add to existing positions and establish new ones.
Portfolio Management
When a sharp market decline occurs, the ultra-short end of the yield curve tends to invert as investors sell those bonds that will have the lowest price impact in order to meet redemptions or rebalance their portfolios by adding higher return, longer maturity instruments. At the end of the quarter, 22% of the CrossingBridge Low Duration High Yield Fund (the Low Duration Fund) was in cash or instruments expected to turn to cash within 30 days and 37% was in cash or was expected to roll off into cash within 90 days. This high level of liquidity allows the Low Duration Fund to maintain its mandate of investing in short duration high yield assets while mitigating credit and spread risk.
Companies are willing to pay very high credit spreads to assure themselves that they have enough liquidity to make it through the economic downturn. Should companies pad their coffers with too much cash from new issuance proceeds, they may use it to redeem shorter-dated obligations. The heightened rate of issuance among both investment grade and high yield companies is presenting an array of potential new investment.
Energy and Shipping Industries
Two industries that had particularly large price declines were energy and shipping. At the end of February, just before the market’s sharp decline, the Low Duration Fund had 8.0% exposure to the energy industry and 2.3% exposure to shipping credits.
With oil prices declining from $60 per barrel at year-end to the low-20s, many formerly viable companies will have difficulty covering operating expenses. Debt of these companies may become permanently impaired. In the best case, lenders will receive restructured debt and equity and, in the worst case, lenders will have to put up new money to protect any value that may be left. The Fund held nine energy-related positions during the quarter, four of which were called or matured. The remaining five included an oil refiner, an oil and gas pipeline operator, one energy services provider and two exploration and production companies. Concerned about their potential outcomes, we may reduce some of our energy exposure. Price declines for energy holdings in the Low Duration Fund accounted for approximately 181 basis points, or approximately 36%, of the Fund’s quarterly decline.
The Low Duration Fund’s shipping holdings were comprised of bonds of five different issuers, all involved in commercial transport. In contrast to some energy bonds, losses in bonds of shipping companies are more likely to be temporary, with full recovery of principal and receipt of interest. Sometimes these temporary marked-to-market losses also provide a “buy” opportunity. Today, prices of many of our shipping bonds reflect the issuers’ cash plus the scrap value of their fleet. Even a modest improvement in the outlook for international trade should cause prices for these bonds to rise. We continue to hold these positions and are considering adding opportunistically. In the Low Duration Fund, shipping positions accounted for 55 basis points, or approximately 11% of the Fund’s quarterly decline.
Further Discussion - 1Q20 and Early April
In order to survive the downturn, corporations that have had access to the market have paid higher financing costs. At the same time, investors have been net sellers of bonds, driving down prices. Below are several examples.
Issuer Adding to Liquidity
Casino Gaming/Hospitality – In early April, a diversified restaurant, hospitality, entertainment and gaming company, issued a $300 million term loan due in 2023. Concurrently, the company’s equity holders made a $50 million equity contribution to the company. The company issued the loan to shore up liquidity in the face of the COVID-19 crisis which has caused the company to close all casino and hotel operations and close approximately one-third of its restaurants, virtually all of the remainder operating only take-out and delivery services. Through an intercompany note, the loan is secured by the company’s equity in their New Jersey online gaming licenses and operations. The online gaming operations are experiencing significant growth and, on their own, are believed to cover the new loan by 85% to 120%. In case there is any shortfall, the loan is also secured on a pari-passu basis with the casino's term loan (mentioned above) which is collateralized by casino's gaming and hospitality operations. The company expects to receive a $100 million loan from the U.S. government through the CARES Act which will further add to liquidity. The loan was issued at a yield to maturity in excess of 14.7%.
Pacific Gas & Electric (PCG)18 – Pacific Gas & Electric (PG&E) is one of the two major investor-owned utilities in California. It filed Ch.11 bankruptcy on January 29, 2019, overwhelmed by liabilities stemming from the 2018 fires that engulfed northern California. At the time of the bankruptcy filing, the company issued a $1.5 billion debtor-in-possession (DIP) financing at LIBOR+225 basis points to ensure that it had enough available liquidity during the bankruptcy process. In order to meet certain regulatory requirements, the company is expected to emerge from bankruptcy by June 30, but, regardless, the DIP has a hard maturity of December 31, 2020. The Low Duration Fund initiated its position in the DIP in March when investors were seeking liquidity during the most severe days of the market decline. With the PG&E DIP believed to be quite secure, the price decline was limited to a few points, but, given the short time period to expected exit, a modest price decline had a significant positive impact on the yield-to-exit. At quarter-end, the Fund’s holdings in the PCG DIP comprised nearly 5% of the portfolio.
DISH DBS Corp (DISH)19– DISH provides direct broadcast satellite subscription television service, audio programming and interactive services to commercial and residential customers in the U.S. It has net leverage20 of 4.5x EBITDA. In January and February, DISH’s 5.125% bonds due May 2020 were trading at yields-to-maturity from 2.25% to 3.00%. When the March downturn occurred, these bonds widened significantly. Many “money-good”21 ultra-short-term bonds exhibited similar price action. The Low Duration Fund purchased these bonds in March at a yield-to-maturity just under 5.8%.
Using Secured Capacity to Raise New Capital
A Major Cruise Line – One of the benefits of the loose underwriting standards over the last several years is that companies will have flexibility in raising capital to get through this period. Case-in-point: most of a specific cruise line's assets were unencumbered, allowing them to issue $4.0 billion of 11.5% senior secured notes due 2023, effectively “priming”22 existing lenders. Assuming that the cash is burned in 2020 and in 2021 the company’s EBITDA recovers to 70% of its previous level, the company will survive but leverage will have increased from 2.4x EBITDA in 2019 to 5.8x in 2021. As the company’s business recovers, however, we believe it will return to positive free cash flow generation, permitting it to return to more normal leverage. We believe this is a good example of other offerings we expect to come to market.
How and When do the Economy and the Markets Recover?
Federal Debt as % of GDP23
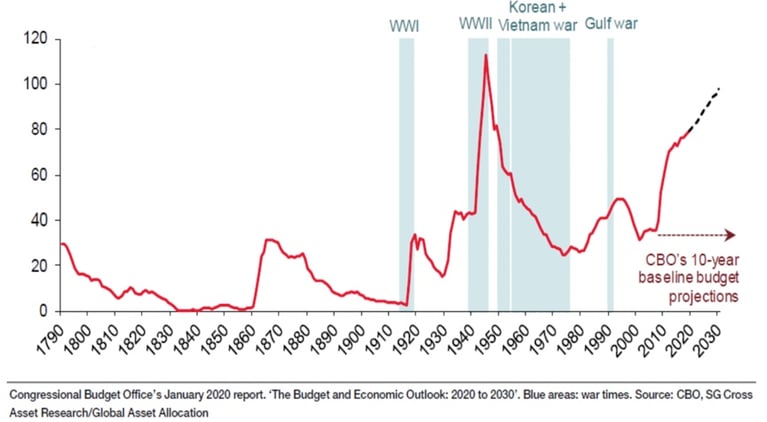
In many ways, the COVID-19 crisis is similar to a war in which we all feel its terrible effect and must pull together to defeat our common enemy. A salient lesson of the Great Financial Crisis (GFC) of 2008 is to rapidly ensure liquidity and stability in the financial system. Beyond simply cutting interest rates virtually to 0%, the Federal Reserve, in conjunction with the U.S. Treasury, has revived some programs that began during the GFC and initiated new programs for market segments previously unaddressed. With the government’s “throw everything at it” attitude, the Fed’s balance sheet is expected to double this year to over $8 trillion24 and Federal debt as a percentage of gross domestic product is projected to rise to 97.8% by 203025, a level not seen since World War II when all of the country’s resources were called upon to achieve victory.
Shift in U.S. Treasury Holdings26
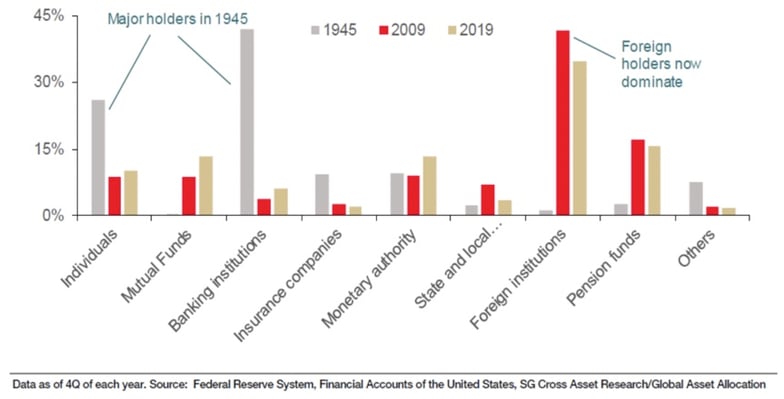
Looking back to World War II, most government debt was internally funded by U.S. individuals and banking institutions, perhaps out of patriotism, but also because most other countries were devoting their resources to their own war effort or internal needs. In 2009 and in 2019, the picture was much different as external financing of U.S. obligations by foreigners was dominant. Among the largest holders, Japan ($1.08 trillion) and China ($1.21 trillion) own U.S. Treasuries as positive-yielding, liquid reserves to manage their own currency and trade balances,27 a benefit of the U.S. dollar being the world’s “reserve currency.” Things are about to change as the bill for COVID-19 and America’s excessive spending will likely require a return to internal funding.
Prior to COVID-19, the U.S. was experiencing the longest expansion in our country’s history. Furthermore, low interest rates, combined with low inflation, caused credit spreads to be historically tight with loose underwriting standards. The timing for recovery is uncertain and the cost of recovery will be expensive. Thus, businesses will ultimately need to de-lever and rebuild their balance sheets. Until we begin to see an increase in “Rising Stars,” high yield credits that are upgraded to investment grade, junk bond credit spreads are likely to remain wide while investment grade credit spreads are likely to narrow.
We expect the high yield market to be divided into three segments. Credits that have potential to be upgraded to investment grade should trade at tighter credit spreads. These may include companies that were fallen angels and are expected to be re-elevated over time. Traditional high yield credits with good businesses and the ability to generate free cash flow under normal conditions may take on additional debt in order to weather the economic downturn, but are likely to repair their balance sheets over time and, based on in-depth credit analysis, may represent good investment opportunities. The lowest quality high yield credits, the “zombies”, are those that generated little free cash flow even in good times and were reliant on the capital markets to repeatedly refinance their debt. These companies are likely to find the financial markets closed and will be one source of the next wave of distress. Those with good businesses but too much debt may ultimately provide us with interesting investments in debtor-in-possession financings and bankruptcy exit facilities. Within each segment, opportunities will emerge.
We maintain an open-door policy and encourage folks to reach out to us (while maintaining a safe distance).
Wishing you good health,

David Sherman and the CrossingBridge team
Endnotes
1 Dusting off an old concept, the defensive interval ratio (DIR) measures the number of days a company can cover its daily operating expenses from current assets. This financial analysis tool may be expanded to a company’s revolving credit facility or alternative cash sources.
2 Moody’s, Default scenarios as coronavirus-induced economic turmoil intensifies, March 27, 2020.
3 J.P. Morgan, Default Monitor, April 1, 2020
4 For historical context, it is noteworthy that the recent high yield sell-off looks very similar to the weeks following the Lehman bankruptcy in September 2008. From the February 21, 2020 high point of the high yield market to March 23, the ICE BofA High Yield Index declined -21.54%; this is comparable to the -20.86% fall that occurred from September 15 to October 15, 2008. With respect to equities, from its all-time high close on February 19, 2020, the S&P 500 Index fell 34% in only 33 days; this compares to the 10 months it took the Index to decline 20% in 2008. Stunning as the recent decline in financial markets has been, it still pales relative to the Great Depression when the S&P 500 declined -28.88% in 4Q29, -34.52% in 3Q31 and -39.40% in 2Q32.
5 CBOE Volatility Index or VIX is a calculation designed to produce a measure of constant, 30 day expected volatility of the US stock market derived from real-time, mid-quote prices of S&P 500 Index call and put options.
6 The unemployment rate at year-end 2019 was 3.5%. Peak all-time U.S. unemployment was 24.9% in 1933.
7 Energy Information Administration
8 Cowen and Company, Oil and Water Monthly, April 6, 2020
9 Cowen and Company, Oil and Water Monthly, April 6, 2020
10 West Texas Intermediate crude oil, U.S. oil price benchmark
11 ICE BofA High Yield Index, Bloomberg
12 ICE BofA Corporate Index, Bloomberg
13 Morgan Stanley, US Corporate Credit – Upgrading Corporate Credit, March 27, 2020
14 Citi Research, US High Yield Strategy Focus, March 27, 2020
15 Goldman Sachs, Credit Notes: Downgrades arrive with a bang: More to come, March 30, 2020
16 Deutsche Bank, US Credit Strategy Chartbook, March 31, 2020
17 Defined as high yield bonds trading with a credit spread greater than 1,000 basis points over the Treasury rate.
18 The Low Duration fund had no position in the Pacific Gas & Electric Debtor-in-Possession Term Loan on 12/31/19. As of 3/31/20, our position in the Pacific Gas & Electric Debtor-in-Possession Term Loan represented 4.96% of the Low Duration Fund.
19 The Low Duration fund had no position in the DISH 5.125% note on 12/31/19. As of 3/31/20, our position in the note represented 0.54% of the Low Duration Fund.
20 Debt less cash divided by the EBITDA for the preceding 12 months
21 “Money good” is a term used by the Advisor to describe debt it believes will be paid off in full under current market conditions and on a strict priority basis.
22 Existing debt is “primed” when a company issues new debt with priority for repayment or claim on assets.
23 Societe Generale, Conviction Thinking, April 2, 2020
24 UBS, US Economic Perspectives, April 9, 2020
25 Congressional Budget Office, The Budget and Economic Outlook: 2020 to 2030, January 2020 (https://www.cbo.gov/system/files/2020-01/56020-CBO-Outlook.pdf)
26 Societe Generale, Conviction Thinking, April 2, 2020
27 Societe Generale, Conviction Thinking, April 2, 2020