
Active Patience
Not to be confused with passive waiting, active patience is deliberately allowing events to percolate until an opportunity may be exploited.
Leading Economic Indicator and Recession Probability Index1
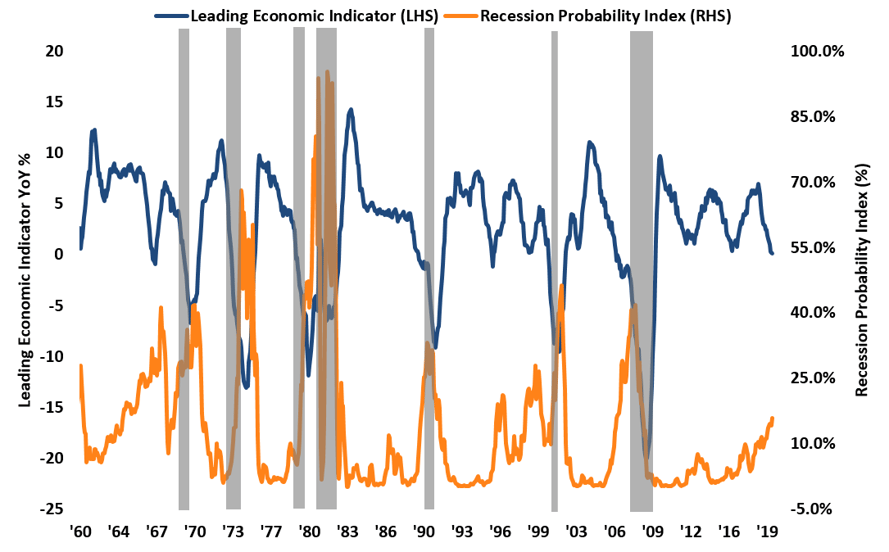
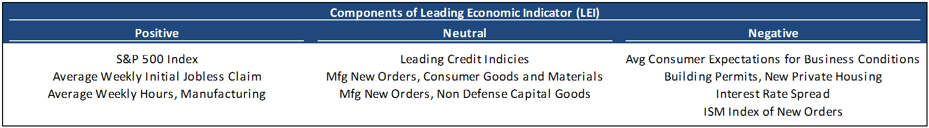
General consensus indicates “clear skies ahead” for 2020. Nonetheless, the Leading Economic Indicators (“LEIs”) are decidedly mixed; the rise in the stock market and “full employment”2 reflect strong optimism while measures of industrial activity and credit conditions are neutral, and business and consumer sentiment are flirting with pessimism. From a historical perspective and in aggregate, the LEIs are signaling either a “v-shaped” rebound or a recession. In this environment, we are certain that selective opportunities will arise as we pursue active patience.
Our focus in 2020, subject to change (portions below bolded for emphasis):
- Convexity Caution3: Avoid duration4 extension that is not properly compensated via higher yield.
- Cushion Bonds5: Pursue bonds priced to a near-term call date that have underappreciated company-specific characteristics that may cause duration to extend while providing a commensurate yield pick-up.
- BBBs over BBs: Favor BBB rated credits that have stable or improving credit profiles.
- Lower-rated High Yield Credit: Focus on B- and CCC instruments that have experienced over-reaction to negative news and/or capital flows.
- Leveraged Loans and Out-of-Favor Industries: Seek loans that have been subject to “forced selling” conditions and explore industry sectors that have been abandoned by investors.
It is “in our DNA” to emphasize credit selection over interest rate prognostication. Although we will not shy away from opportunities in longer-dated instruments where the potential risk-adjusted return outweighs interest rate risk, we tend to focus on shorter maturities.
More than 70% of the US High Yield Index is Call Constrained;
Index Duration is at Record Low6
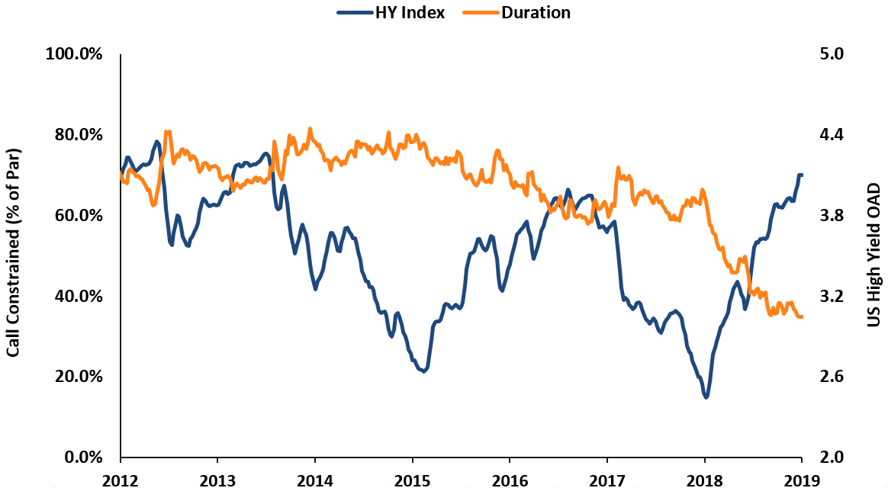
The decline in interest rates and narrowing of credit spreads experienced in 2019 has caused more than 70% of the high yield (HY) market to become “call-constrained” and duration for the market to fall to the lowest level since 2012. Further capital appreciation is constrained with the expectation that issuers will redeem their debt early (prior to maturity) to take advantage of current market conditions. A portfolio of call-constrained bonds may appear to have low duration but is subject to “extension risk” should market conditions change to diminish the likelihood of early repayment, a concept known as “negative convexity.”
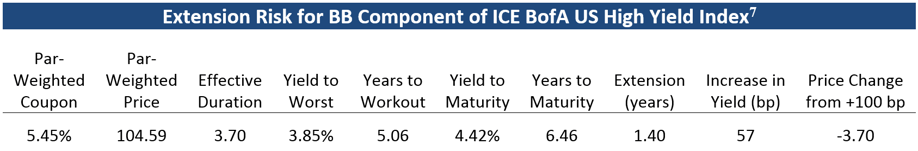
Given that BB bonds represent nearly 50% of the high yield market8 and approximately 87% of BB bonds are call-constrained, this segment of the index provides a good example of the risk posed by negative convexity. The table above illustrates that an increase in credit spreads or rates by 100 basis points (bps) is likely to extend out the expected repayment date from the call date to maturity by 1.40 years. Should this occur instantly, the yield would increase by 57 basis points, but the index would experience an immediate principal loss of 3.7 points, erasing over 95% of the expected return for the year.
Large Percentage of Callable Bonds are not Redeemed9
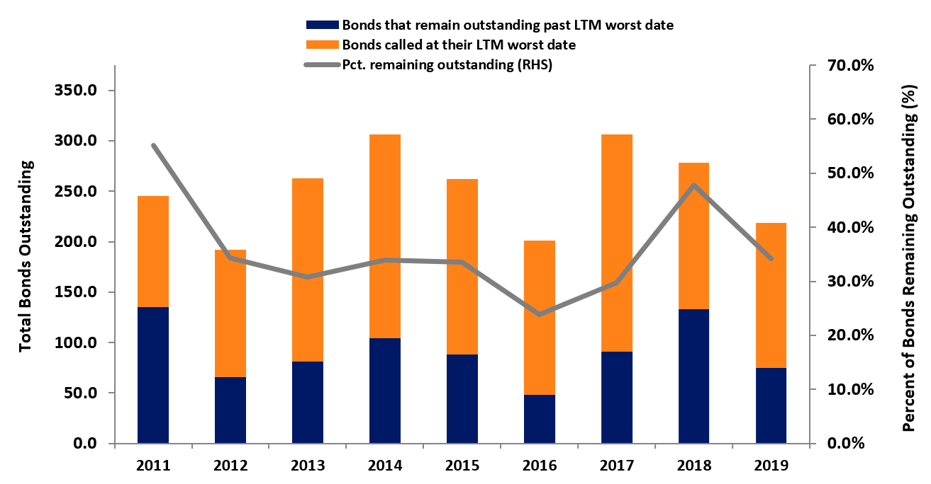
The rise in the portion of the high yield market that is call-constrained has also increased the number of cushion bonds, a segment in which we actively invest. Moreover, as shown above, a significant portion of bonds remain outstanding even after their Yield-to-Worst (“YTW”) call date. Why is that? Corporations may put off repaying a bond prior to maturity even though, economically, they would benefit, for strategic reasons. Similarly, a homeowner may forego refinancing a mortgage because of retirement plans that include selling the house in the next several years. Thus, part of our strategy is to identify cushion bonds that may extend and capture greater yield than market expectation. An example of this potential opportunity arises when private equity funds are in their harvest periods during which they will be realizing gains from their leveraged buyouts.
BBBs as a % of Total U.S. Corporate Bond Market10
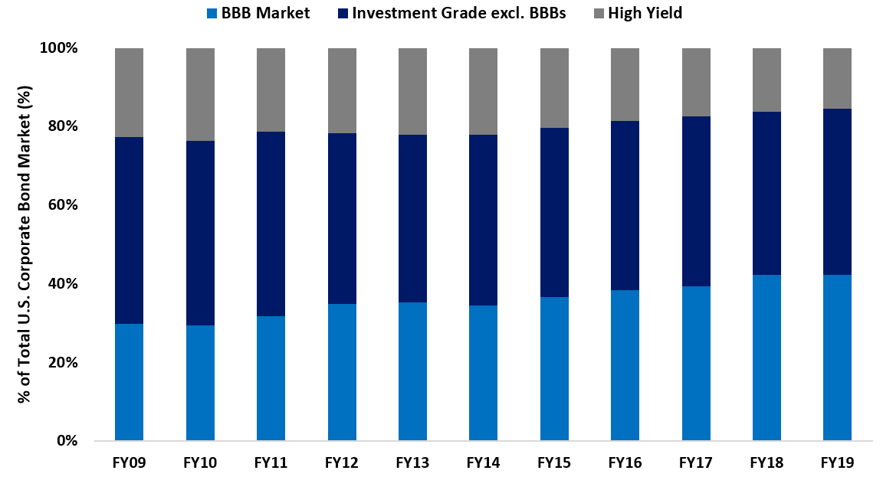
Unlike high yield bonds, most investment grade debt has good call protection. Further, price movement of investment grade (IG) bonds tends to be more sensitive to interest rate movement while high yield bond prices tend to be more sensitive to changes in credit spreads. Our concern that BB credit spreads are tight relative to BBBs supersedes our concern about rising interest rates, although we suspect the yield curve will steepen.11
The population of BBB corporate bonds has grown from less than $800 billion in 2007 to over $3.5 trillion at the end of 201912. This has been driven by issuers’ willingness to allow their credit quality to decline and investors’ willingness to buy. Ultimately, when an economic downturn occurs, there will be a portion of the BBB segment that will be downgraded into high yield. As a result, the influx from downgrades may swamp the high yield universe, particularly BB credits. Assuming investor demand is static, a scarcity of BBBs and an abundance of BBs would occur, causing BBB spreads to narrow and BB spreads to widen. Historically, 7-10% of BBBs are downgraded during an economic downturn, which would increase the BB universe by approximately 50%13. Further, an economic downturn is not necessary if the life cycle of businesses continues to be challenged and shortened by advancements in technology and “easy money” capital markets. The technical pressures that BBBs now pose to the BB universe, combined with BB negative convexity and absolute tight spreads between the BBBs and BBs favors investing in BBB credits over BBs.
Option Adjusted Spread Ratios14
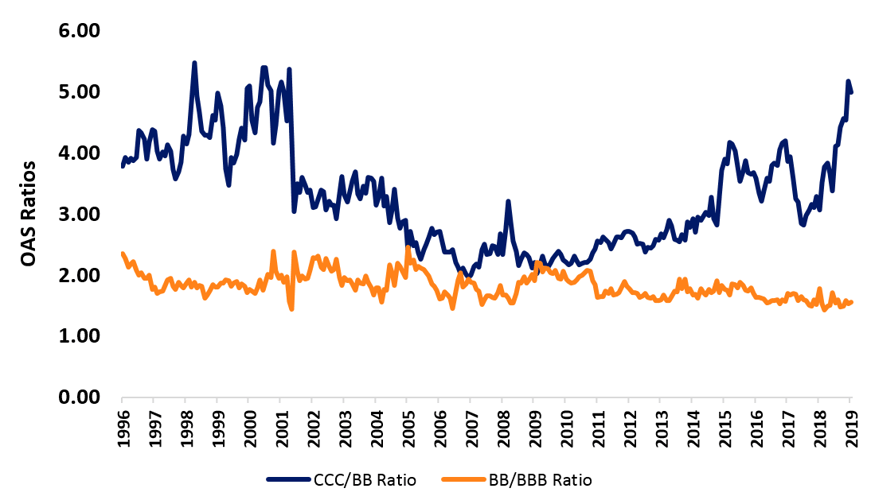
Credit spreads for single A and BBB bonds are narrow versus their historic average, but solidly within one standard deviation15. In the case of high yield, CCC spreads are a little bit below their historic average and single B spreads are narrow relative to historic levels, but still inside one standard deviation. Notably, however, BB credit spreads are very narrow versus history, nearly one standard deviation lower than average16. Taking this analysis a step further, the graph above shows the ratio of option-adjusted credit spreads17 (“OAS”) between different credit qualities. Clearly, the increase in yield that can be achieved by venturing from investment grade to high yield, in this case from BBB to BB, has diminished over the last several years to nearly the narrowest level in over 20 years. In contrast, there has been a sharp increase in the OAS that may be captured by moving from the highest quality high yield bond, BB, to the lowest, CCC. This graphically illustrates the dispersion that has taken place in the high yield market, with investors aggressively bidding for BB credit while shunning CCC. The bifurcation in the high yield market provides potential, particularly among B- and CCC credits, to find attractive yields ignored by others.
Implied Zero Coupon Bond Price of Top 50 On-the-Run 5y IG and HY CDS18
(12/31/19)
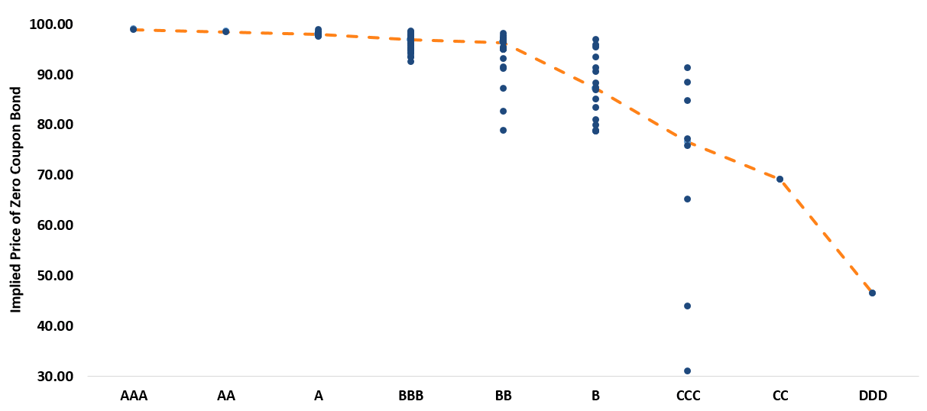
Obviously, lower quality high yield credit cannot be painted with a broad brush. Using the market price for credit default swaps to derive an implied price for zero-coupon bonds, shown in the graph above, illustrates that the probability of a default event is extremely low for investment grade credits. There is a sharp increase in the probability of a default event in moving from BBB to BB, but, curiously, market pricing suggests that the market is reflecting little difference in credit risk between BB and B credits. Moreover, with a significant portion of the CCC credits in the sample priced 79-92, the market is indicating mispriced prospects within the CCC segment. A low interest rate environment provides multiple options for companies to de-lever proactively, such as refinancing or obtaining higher values for asset dispositions. At year end, the OAS of CCCs relative to BBs was greater than 5x, one of the highest levels over the past 23 years. This excess spread multiple of CCCs is not commensurate with increased market and credit risk of BBs for the same period.
Leveraged Loan Universe Ownership by Fund Type19
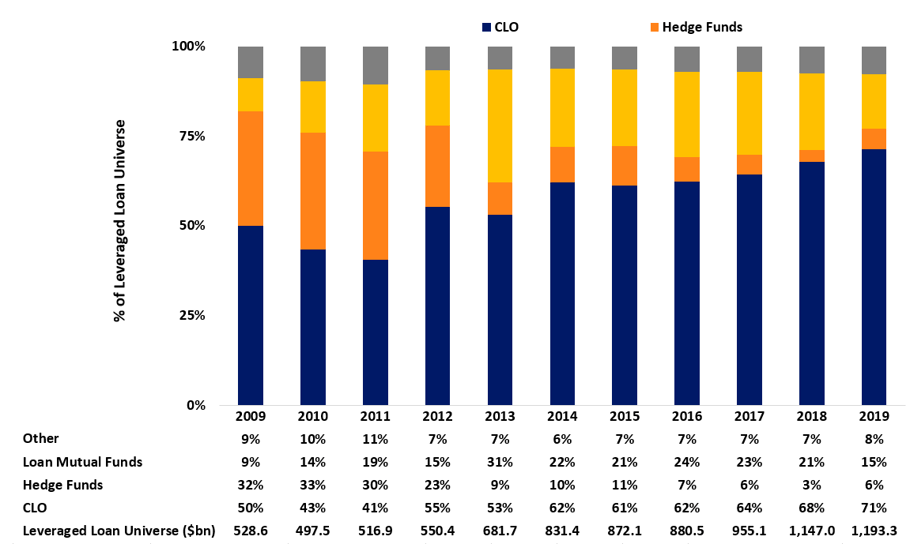
Over the last ten years, the leverage loan market’s size has more than doubled to almost $1.2 trillion and collateralized loan obligations20 (“CLOs”) have increased their ownership of this asset class from 50% to over 70%, around $850 billion21. This growth has led CLO managers to become more aggressive in constructing their portfolios resulting in looser underwriting standards with respect to covenants and financial metrics. Further, the structure of CLOs incentivizes holding loans to maturity rather than realizing a capital loss. This dynamic impacts pricing in the leveraged loan market. Often, prices of deteriorating credits remain too high until outside forces demand a day of reckoning. One such force is the downgrade of a credit to CCC because CLOs are typically limited in their ability to hold loans with this rating.
Since CLOs tend to hold loans for the long term and represent over 70% of the loan market, the incremental seller of a loan may create a sudden price decline. In 2019, mutual funds dedicated to this asset class incurred investor redemptions causing net outflows. This was partially
responsible for 14%22 of the loan market trading below a price of 90 in 4Q1923. In addition, downgrades and increased defaults made buyers more circumspect driving the bifurcation in the loan market between higher quality and lower quality issues. This has provided some openings for advantageous loan purchases, but it will take larger price declines for opportunistic hedge funds to increase their commitment to the asset class from their current 6% participation back toward their 32% share 10 years ago. In the alternative scenario, in which the yield curve steepens and the credit environment remains benign, we are likely to see an acceleration in the growth of CLOs that will reverse the direction of loan prices, but further encourage aggressive lending practices. Meanwhile, we are building a shopping list.
Investors’ preference for higher quality over lower quality credit naturally has led them to avoid certain troubled industries such as energy and retail. While mucking the stable one can find a diamond in the rough, but it requires the patience of looking for a needle in a haystack. (Yes, I know I am mixing metaphors).
John Meynard Keynes said, "The political problem of mankind is to combine three things: economic efficiency, social justice and individual liberty."24
With active patience, we hope to have Keynes’ mindfulness and aspire to perfect vision in 2020.

David Sherman and the CrossingBridge team
Endnotes
1 Federal Reserve Bank of New York; Credit Call, Barclays Research, January 7th, 2020; Conference Board Leading Economic Index
2 “Full employment” occurs when labor is being most efficiently engaged without raising inflation. Today, some economists are puzzled that inflation remains below the Federal Reserve’s 2% target despite full employment.
3 Bond prices move inversely to changes in yields (either due to movement in Treasury rates or credit spreads); an increase in yields will cause bond prices to decline and vice versa. Duration measures the sensitivity of bond prices to changes in yields while convexity reflects the rate at which duration increases or decreases based on the change in the rate environment. For individual securities, specific provisions, such as the borrower’s ability to prepay, may impact convexity.
4 Duration is sometimes confused with bond maturity because “Macaulay duration”, measured in years, is the weighted average time until all of a bond’s cash flows are paid. In the context above, however, we are referring to “modified duration” which measures the sensitivity of a bonds’ price to a 1% change in interest rates.
5 Cushion bonds are fixed coupon obligations for which the yield-to-maturity exceeds the yield-to-call.
6 US Credit Alpha, Barclays Research, January 17th, 2020
7 ICE BofA US High Yield Index, Bloomberg
8 ICE BofA US High Yield Index
9 Credit Strategy Daily, Credit Suisse Research, January 21st, 2020
10 ICE BofA US Corporate Index, ICE BofA BBB US Corporate Index, ICE BofA US High Yield Index, Bloomberg
11 In addition to various macroeconomic factors, the growing supply of securities with longer maturities suggests that the yield curve is likely to steepen. Longer maturities for recently issued corporate bonds reflects borrowers’ preference to lock in low rates for longer periods. Similarly, on January 16, 2020, the U.S. Treasury announced its intention to issue 20-year U.S. Treasury bonds for the first time in 34 years.
12 Macro Credit Musings, Jefferies, January 21, 2020
13 Macro Credit Musings, Jefferies, January 21, 2020
14 ICE BofA US Corporate Index, ICE BofA BBB US Corporate Index, ICE BofA US High Yield Index, Bloomberg
15 The option-adjusted spread is the yield-to-maturity for a fixed-rate bond less the risk-free rate (e.g. U.S. Treasury rate of similar maturity), adjusted for embedded call options permitting the issuer to redeem the bond before maturity.
16 Components of the ICE BofA US Corporate Index going back to 12/31/96, CrossingBridge calculation
17 Components of the ICE BofA US High Yield Index going back to 12/31/96, CrossingBridge calculation
18 Components of the ICE BofA US High Yield Index going back to 12/31/96, CrossingBridge calculation
19 Bank of America Research, Bloomberg, CrossingBridge estimates
20 Collateralized loan obligations are actively managed, diversified pools of loans which provide collateral for issuance of multiple tranches of debt and equity. The pool of loans provides cash flow to fund payment of principal and interest to the various tranches which is distributed based on a specified order of priority of the tranches.
21 Collateral Thinking, Bank of America Research, January 15th, 2020; Jefferies Research; S&P Global LCD
22 For comparison purposes, per Credit Suisse Research, 10.2% of the high yield bond market was trading at 90 or below as December 31, 2019.
23 The essay was titled 'Liberalism and Labour' (1926). This essay originated as a speech given at the Manchester Reform Club, 9 February 1926, at a time when the numbers of the three parties in the House of Commons caused speculation as to a possible combination of Liberals and Labour against the Conservatives. The address was published as an article entitled ‘Liberalism and Labour’ in the Nation and Athenaeum, 20 February 1926.
Definitions
Yield to Worst: the lowest potential yield that can be received on a bond without the issuer actually defaulting. The YTW is calculated by making worst-case scenario assumptions on the issue by calculating the return that would be received if the issuer uses provisions, including prepayments, calls or sinking funds. This metric is used to evaluate the worst-case scenario for yield to help investors manage risks and ensure that specific income requirements will still be met even in the worst scenarios.
Yield to Maturity: the total return anticipated on a bond if the bond is held until it matures. Yield to maturity is considered a long-term bond yield but is expressed as an annual rate.
Investment Grade: a rating that signifies a municipal or corporate bond presents a relatively low risk of default. Bond rating firms like Standard & Poor’s and Moody's use different designations, consisting of the upper- and lower-case letters "A" and "B," to identify a bond's credit quality rating.