The song Locomotive Breath portrays a loss of control resulting from extreme, unanticipated events and the need to make the best of it as we go forward, which could describe today’s geopolitical and economic backdrop. In our 2021 year-end letter, we anticipated significant volatility. However, the events of this year have been beyond our expectations with the Russian invasion of Ukraine exacerbating ongoing challenges posed by inflation and supply chain bottlenecks. Capital preservation and investment success often come down to how an investor weathers these episodes and finds ways to take advantage of them.
Locomotive Breath1
In the shuffling madness
Of the locomotive breath
Runs the all-time loser
Headlong to his death
Oh, he feels the piston scraping
Steam breaking on his brow
Old Charlie stole the handle
And the train it won't stop
Oh no way to slow down…
No way to slow down
No way to slow down
The song Locomotive Breath portrays a loss of control resulting from extreme, unanticipated events and the need to make the best of it as we go forward, which could describe today’s geopolitical and economic backdrop. In our 2021 year-end letter, we anticipated significant volatility. However, the events of this year have been beyond our expectations with the Russian invasion of Ukraine exacerbating ongoing challenges posed by inflation and supply chain bottlenecks. Capital preservation and investment success often come down to how an investor weathers these episodes and finds ways to take advantage of them.
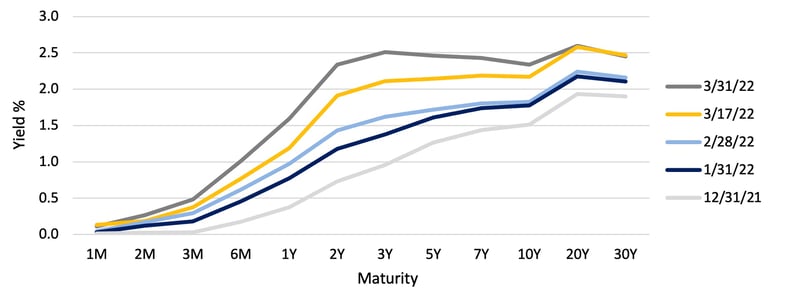
US Treasury Curve2
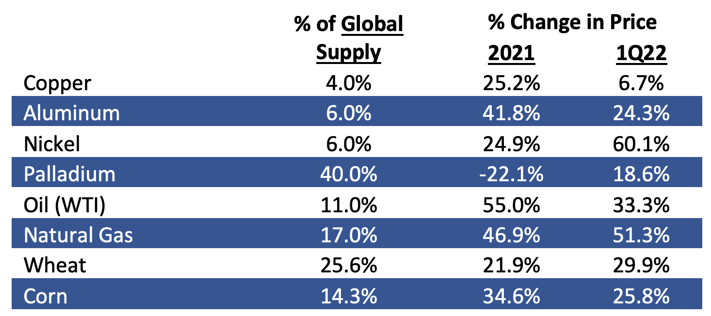
Ukraine/Russia - Production and Commodity Price Changes3
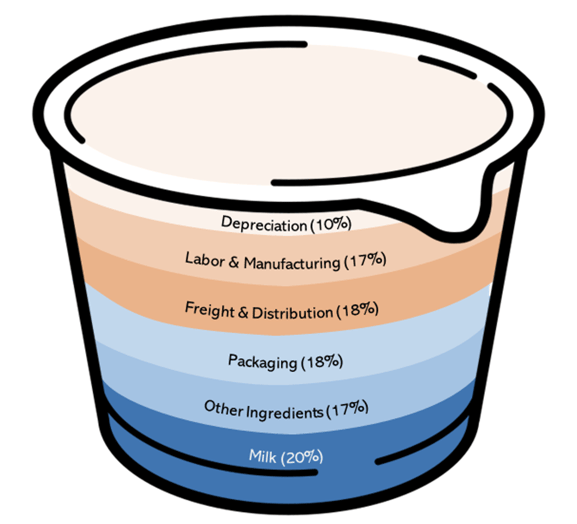
Estimated Cost Components for Yogurt5
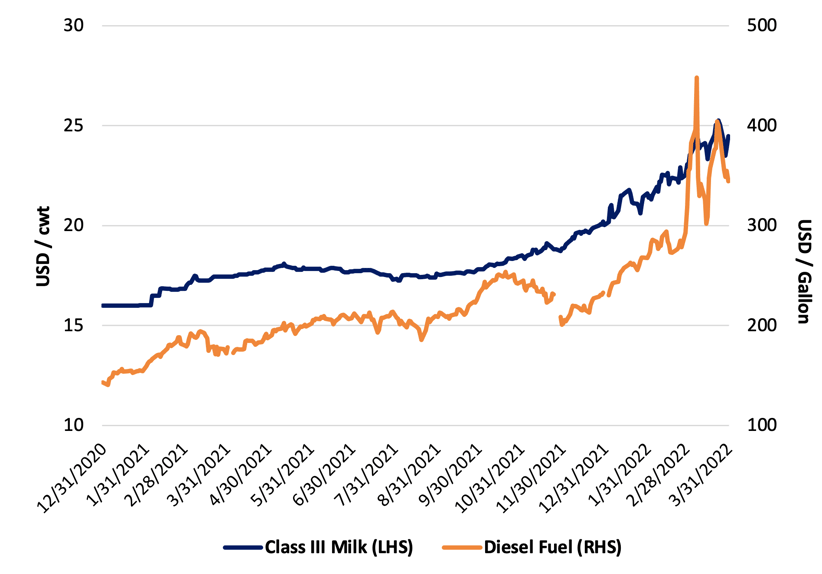
Increasing Input Costs
Chobani Global Holdings, LLC (CHBANI)6 – Chobani is a leading natural food company that primarily manufactures, markets and sells Greek yogurt and yogurt-based products in the U.S. The company’s yogurt products hold the #1 market share position, and they are aggressively leveraging their brand into additional products. We began purchasing the 7.5% senior unsecured bonds in March 2021 and continued through the year at an average price that would result in a 4.5% yield, were the bond called on April 15, 2022, and 6.20% yield if held to the 4/15/25 maturity.7 Through our analysis of the company, we concluded that it would continue to grow and that net leverage was reasonable at 6.1x. We also liked the “cushion”8 characteristics of the bond and the added bonus that a much-rumored IPO might produce proceeds enabling an early redemption, increasing yield.
Impact of Rise in Input Costs - Following a modest dip in revenues at the beginning of the pandemic, the company achieved solid revenue growth in 2020 and 2021 by outpacing the yogurt industry and successfully introducing several new products (creamers, oat milk, etc.). EBITDA grew in 2020, largely due to a reduction in SG&A, but flattened in 2021 as a result of increased marketing expenses and a decline in gross margin related to an increase in costs for inputs including milk prices, transportation and packaging, partly offset by lower costs for other ingredients. The prices for milk9 and diesel fuel10 (for transportation) have continued to rise, increasing 22.1% and 48.0%,11 respectively, during 1Q22. These increased costs are partially being offset by the 24.7%12 rise in butter13 prices in 1Q22, which is mirrored in the selling price of cream, a by-product of yogurt production. As is the case with other yogurt producers, Chobani is raising prices through a combination of cash price increases, product size reductions and reductions in promotional activity, with the gross margin benefits likely to be realized in the second half of 2022. According to Nielsen data for March 2022,14 yogurt sales have remained strong, +9.2% versus last year, despite the fact that prices have risen 7.7%, suggesting that consumer demand is currently inelastic.
Class III Milk and Diesel Fuel15
Bond Pricing and Current View - During 1Q22, the price of the Chobani bond declined from approximately 103 to just below 97, reflecting the view that an IPO and refinancing are not imminent. This was due to the general rise in interest rates, widening of high yield credit spreads and investor concern that the company’s credit quality may be negatively impacted by rising input costs. We purchased the bonds in 2021 based on an expectation that the bonds may be refinanced early, but, if that were not the case, the yield would rise to compensate us for the extension in the expected repayment date toward maturity, an acceptable outcome. At the end of 1Q22, the bond was trading at a yield-to-maturity of 8.64% in comparison to 6.20% a year prior. The 244 basis point increase in yield-to-maturity reflects a 51 basis point increase in credit spread with 193 basis points related to interest rate movement. We remain comfortable with the credit: the brand has great customer loyalty, which is permitting product line extension and, as suggested above, likely will allow price increases to be partially passed through to consumers. At year-end, we estimate that net leverage was 6.3x and cash interest expense coverage was 2.5x. Although Chobani has experienced some credit deterioration due to margin squeeze, liquidity is strong, there are no imminent debt maturities and gross debt remains below $1.4 billion, far below the $10 billion expected IPO valuation.16 Thus, the mark-to-market price decline provided an opportunity to add to the position at an attractive yield. Should the market stabilize so that Chobani can execute an IPO and use the proceeds to repay the bonds prior to the 2025 maturity, the total return would be higher than the current yield-to-maturity because the discount from par would be amortized over a shorter period of time.
Impact of the Pandemic, Inflation and Higher Rates
Fresh Market (TFM)17 – Fresh Market is a chain of 159 mid-sized, fresh food-focused grocery stores, with perishables making up 71% of sales (versus 35% in traditional grocery stores). Its targeted consumer is similar to that of Whole Foods, owned by Amazon. Fresh Market particularly benefitted from the sharp increase in in-home eating caused by the pandemic. Although customer traffic declined by 10% as consumers limited trips outside the home, average transaction size increased 25% and same-store sales rose 22%. As a result, EBITDA nearly doubled year-over-year, and the company reduced leverage from 6.7x at the end of fiscal 2020 to 3.3x at the end of the fiscal year ended January 2021. Focused on the sharply improved operating performance and a better credit profile, we began purchasing the 9.75% Secured Note, due May 1, 2023 in the first half of 2021. The purchases made throughout the year had yields-to- maturity in excess of 7.70%.
Retail to Wholesale Inflation Spread (2-Year Stack)18
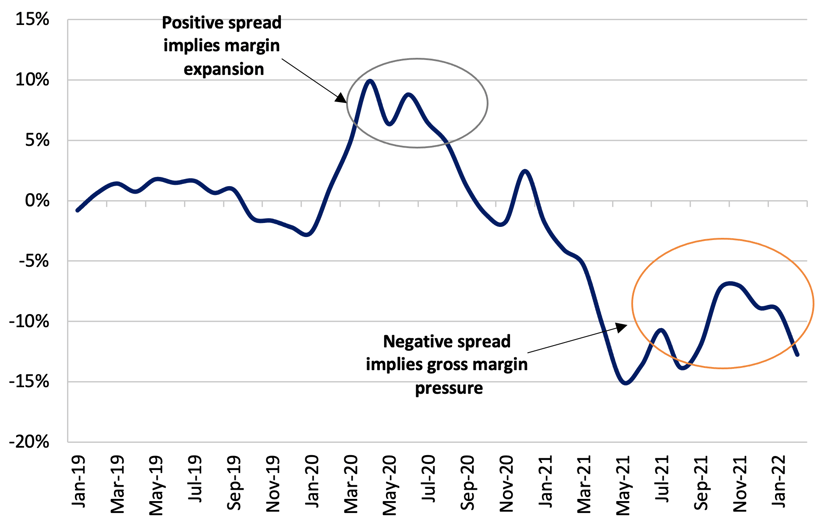
Impact of Re-Opening and Inflation – In the two years ended February 2022, the consumer price index for food at home has risen 12.5% led by meat/poultry/fish/eggs at 18.9% and fruits & vegetables at 11.3%,19 categories which Fresh Market emphasizes. As shown above, the difference between retail and wholesale inflation turned negative in 1Q21, implying shrinking margins for grocers. Thus, with the recent sharp rise in gasoline prices, coupled with food inflation, grocers face the potential for lower margins and the risk that consumers shift food spending toward lower cost alternatives.
In 2021, Fresh Market’s growth slowed from the torrid pace of calendar year 2020, particularly during the summer and fall as the pandemic eased and people were eager to get out of their homes. As a result, for the nine months ended October 2021, Fresh Market’s transaction count increased by 9.3%, reflecting greater customer comfort in visiting stores, but same-store sales growth slowed to 3.2%, still solid, and average transaction size declined 5.6% as consumers felt less need to fill their pantries. Directionally mirroring the graph above, EBITDA margin fell from 11.6%, in the first three quarters of 2020, to 9.9% in the comparable period in 2021. As a result, net leverage rose from 3.3x to 3.7x during the first three quarters of 2021. That said, even if EBITDA were to fall by 25% in 2022, net leverage would only rise to 5.0x, still healthy for a grocery store credit. As Fresh Market targets a consumer who tends to focus on fresh food and healthier alternatives, it is likely to be less impacted by rising prices. Moreover, while commodity food prices may experience sharp spikes in response to adverse events, these have proven to be transitory with consumer food prices determined more by surplus or deficit driven by seasonal harvests, highly dependent on weather, and cost of non-food components such as marketing, packaging and transportation.20
Impact of Higher Interest Rates – Fresh Market is focused on reduction of leverage, having recently repaid $90 million of a senior priority note with funds generated from operations, leaving $43 million outstanding. The bond we own matures on May 1, 2023; thus, Fresh Market must find a way to repay the bond by that date or face default. We believe the company has several avenues to effect repayment of the bond. In July 2021, Fresh Market filed an S-1 Registration Statement for an IPO, which was updated on March 14, 2022. The IPO has been deferred thus far due to market conditions, but, if the environment improves, IPO proceeds would likely be used to repay the bond. The company could also pursue a debt financing, issuing either a new secured bond or a combination of bonds and term loan that would provide prepayment flexibility. Fresh Market is currently rated B3/B- (Moody's/S&P). We estimate that the credit spread for a B3/B- bond would be about 540 basis points while CCC bonds would have a spread of about 750 basis points.21 Thus a new 5-year bond would likely be issued at a yield between 8.00% and 10.00%. This would still result in interest expense comparable to or lower than the company is currently paying on its 9.75% bond. Were the company to elect to split the capital raise between a new bond and a term loan, the total interest cost might be a bit lower. Additionally, the company’s private equity sponsor, Apollo, recently provided capital to allow it to repay its revolving credit facility. Thus, it is reasonable to think that Apollo would step up to protect its equity position. Lastly, the company would be an attractive strategic acquisition for a competitor. All-in, we believe that the value of the company exceeds the debt through the bonds we hold.
Bond Pricing and Current View - During 1Q22, the price of the Fresh Market bond declined from approximately 103 to 98.25, resulting in an increase in its yield-to-maturity from 7.34% to 11.49%. We attribute most of the decline to high yield funds “taking some chips off the table” by selling a short maturity bond to meet outflows. Taking advantage of this price decline, we added to the position during the quarter.
Rising Energy Prices, Changing Supply Lines
Golar LNG Ltd.22 – Golar LNG Ltd. is a lessor and operator of liquefied natural gas (LNG) transport ships, floating natural gas liquefying systems (FLNGs) and a floating storage regassification unit (FSRU). LNG ships take on natural gas that has been cooled into a liquid state to permit transport to distant ports for re-gasification and distribution. The FLNGs, positioned near offshore gas production wells, efficiently liquefy natural gas on-site using cold seawater, avoiding the need for pipelines linked to on-shore liquefaction facilities. The FSRU stores LNG and has onboard facilities that convert LNG back into its gaseous state. Comfortable with the quality of the company’s hard assets and confident that cash flow from operations would permit deleveraging, in October 2021, we participated in the new issuance of Golar’s 7% unsecured bonds due 2025. The new issue proceeds were used to repay their convertible bond due in February 2022. At that time, leverage net of cash was 6.6x and leverage net of cash and equity investments was 4.8x.
Retail to Wholesale Inflation Spread (2-Year Stack)23
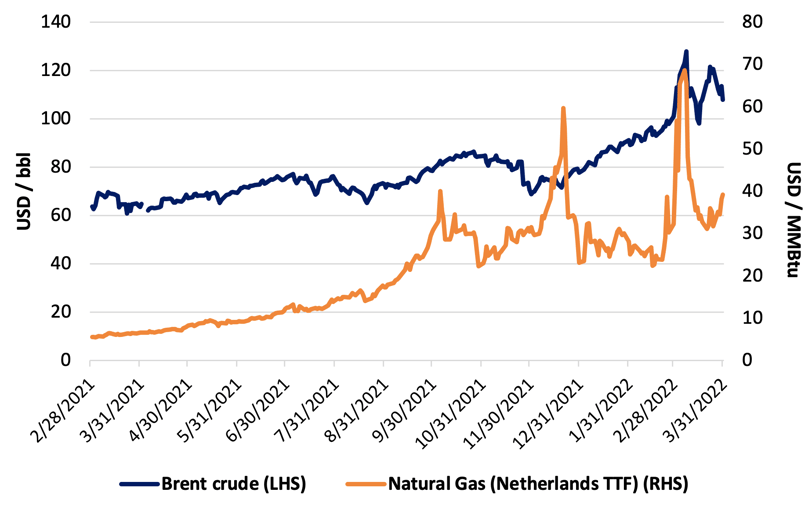
Impact of Rising Energy Prices – The recent rise in oil prices has had a dual benefit for Golar:
- Contract Pricing - The contract for the FLNG vessel, Hilli, provides for a minimum level of EBITDA, but also includes a pricing escalator that has the net effect of increasing EBITDA by $2.7 million per year for every dollar above $60/barrel for Brent crude and $3.7 million per year for each dollar above $1.60/MMBtu for Dutch TTF (natural gas). With Brent averaging $70.87/barrel and TTF averaging $17.91 in 2021,24 Golar saw a sharp rise in EBITDA in 2021. This is expected to rise further in 2022 as, in 1Q22, Brent has averaged $97.59/barrel and TTF has averaged $32.43/MMBtu.25 The rise in energy prices also afforded the company the opportunity to sign a long-term contract with BP for its second FLNG vessel, Gimi, currently 80% complete and expected to be commissioned by the end of 2023. This contract is expected to produce $151 million of EBITDA per year beginning in 2024.26
- Asset Value - Rising demand for LNG in Europe and Japan has led to increasing need for transport capacity. As a result, the company’s fleet of LNG vessels became very attractive to potential buyers and, in December 2021, Golar agreed to sell 8 of its 9 LNG transport vessels to Cool Company Ltd., a publicly-traded Norwegian company. In exchange, Golar received cash, equity in Cool and assumption of debt with a value representing 8.1x estimated EBITDA. With this transaction leading to a substantial reduction in debt, leverage net of cash declined to 6.0x and, net of cash and equity investments, 1.7x.
Golar 7.00% Unsecured Bond Due 10/20/25

US SPAC Liquidation Wall31
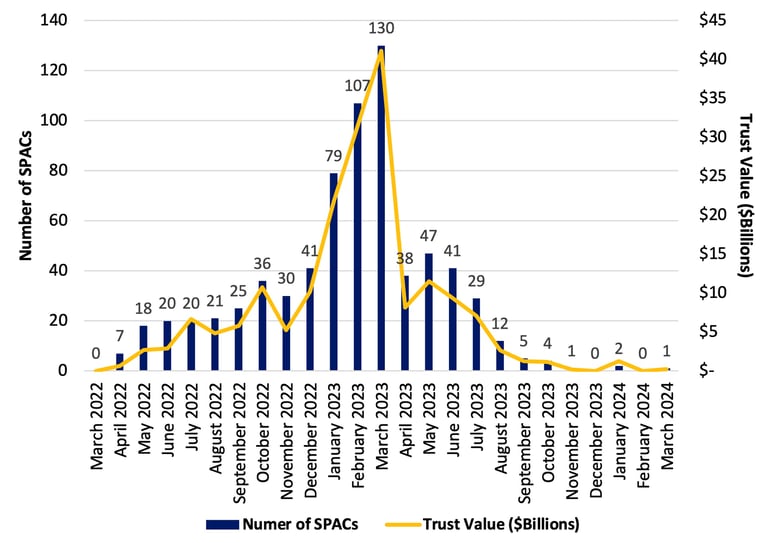
As shown above, there are billions of dollars of capital in trust accounts of SPACs that have yet to complete a merger. However, as each day passes, they are moving toward the date at which they must liquidate, returning their capital to shareholders. This effectively represents the universe of SPACs from which we can select investments for our fixed income-oriented approach to SPACs. The spike in the number of SPACs reaching their liquidation date in early 2023 is an echo of the peak in SPAC issuance during the summer of 2021, reflecting the typical 18-month period during which a SPAC can look for a merger partner.

Some have taken note that the yield curve has inverted35 between the 3-year and 10-year maturities and pointed to curve inversion as a harbinger of recession. However, members of the Federal Reserve have been dismissive of the signaling power of a 2-year versus 10-year inversion and only become concerned when an inversion of the 3-month T-Bill versus the 10-year bond becomes deeply negative and persistent.38 Thus, with the curve quite steep beyond 3 months, the labor market red-hot and GDP at its highest level in over 20 years39 a recession may seem far off. But what do we know?
Focusing on the fundamentals,
David K. Sherman and the CrossingBridge Team
Endnotes:
1Ian Anderson, the bandleader who wrote Jethro Tull’s 1971 progressive rock song, Locomotive Breath (https://www.youtube.com/watch?v=c4JqvK3Fwn8), explained the lyrics of the song as follows: “We really have to face up to enormous changes…That we are on this seemingly lemming-like suicide mission in terms of an unstoppable force that we seem incapable of dealing with.” http://rockandrollgarage.com/jethro-tulls-ian-anderson-explains-the-meaning-of-locomotive-breath/
2Bloomberg
3Bloomberg and Ukraine/Russia conflict: The read-through for US HY supply chains, Goldman Sachs, 3/11/22
4Ukraine/Russia conflict: The read-through for US HY supply chains, Goldman Sachs, 3/11/22
5Cohanzick estimate based on input from Goldman Sachs, Jefferies and Chobani Inc. Form S-1 Registration Statement, 11/17/21
6As of 12/31/2021 our position in Chobani represented 1.91% of the Low Duration High Yield Fund, 0.00% of the Ultra-Short Duration Fund, and 3.50% of the Responsible Credit Fund. As of 3/31/2022 our position in Chobani represented 1.91% of the Low Duration High Yield Fund, 0.00% of the Ultra-Short Duration Fund, and 3.28% of the Responsible Credit Fund.
7Bond prices and implied yields throughout this letter are based on prices provided by independent pricing services employed by fund custodians including, but not limited to, IDC and Reuters.
8A “cushion” bond is a callable bond with a high coupon that provides a higher yield the longer it remains outstanding.
9Class III Fluid Milk, Bloomberg <DAK2>
10US Gulf Coast Ultra Low Sulfur Diesel Fuel, Bloomberg <DIEIGULP>
11Bloomberg
12Bloomberg
13Butter, Bloomberg <BUT1>
14Nielsen Update – March – Batteries, Beauty, Bleach, Tobacco, Yogurt and KHC, Barclays, 4/5/22
15Bloomberg
16Chobani’s IPO Is Delayed Yet Again Amid a Lull in Issuance, Barrons.com, 3/11/22 https://www.barrons.com/articles/chobani-stock-ipo-delayed-51647035549
17As of 12/31/2021 our position in Fresh Market represented 2.27% of the Low Duration High Yield Fund, 1.45% of the Ultra-Short Duration Fund, and 2.81% of the Responsible Credit Fund. As of 3/31/2022 our position in Fresh Market represented 3.55% of the Low Duration High Yield Fund, 3.41% of the Ultra-Short Duration Fund, and 3.52% of the Responsible Credit Fund.
18Food Retail – Inflation Deep Dive…, Wolfe Research, 3/15/22
19Food Retail – Inflation Deep Dive…, Wolfe Research, 3/15/22
20Food inflation to spike briefly as commodity prices bite, Oxford Economics, 4/6/22
21High Yield Daily Update, JP Morgan, 4/5/22
22As of 12/31/2021 our position in Golar represented 3.07% of the Low Duration High Yield Fund, 0.00% of the Ultra-Short Duration Fund, and 0.00% of the Responsible Credit Fund. As of 3/31/2022 our position in Golar represented 2.02% of the Low Duration High Yield Fund, 1.49% of the Ultra-Short Duration Fund, and 2.02% of the Responsible Credit Fund.
23Bloomberg
24Bloomberg
25Bloomberg
26Golar LNG Ltd.
27Bloomberg
28At 3/31/22 CrossingBridge Low Duration High Yield Fund 11.3%, CrossingBridge Ultra-Short Duration Fund 12.1%, and CrossingBridge Responsible Credit Fund 17.2%.
29For an academic study regarding the quality and effect of greater disclosure for SPACs, see SPACs and Forward-Looking Disclosure: Hype or Information, Chapman, Frankel and Martin, October 2021
30For an academic study of the merit of capital formation via SPAC transactions, see PE for the Public: The Rise of SPACs, Gryglewicz, Hartman-Glaser and Mayer, 3/18/22
31www.SPACinformer.com SPACinformer.com is owned by eBuild Ventures, an affiliate of Cohanzick Management, LLC.
32www.SPACinformer.com SPACinformer.com is owned by eBuild Ventures, an affiliate of Cohanzick Management, LLC.
33The 1.375% Treasury Bond maturing on February 15, 2023 had a yield to maturity of 1.59% on March 31, 2022.
34For those interested, we recommend Train Wreck: The Forensics of Rail Disaster, George Bibel, The Johns Hopkins University Press 2012
35An “inverted” yield curve is one in which shorter rates are higher than longer rates.
36Yield curve: Flashing orange, Barclays, 3/29/22
37Bloomberg

