
Currently, investors are caught in an economic “No Man’s Land” between the dangers of inflation and fears of recession as the Fed continues to raise interest rates. In the first half of 2022, U.S. equities and fixed income portfolios suffered some of their largest losses in history leaving many investors shell-shocked. Just as the poppies returned to Flander’s fields, the decline in the markets is creating opportunities for investors.
![]()
In Flanders Fields1
| In Flanders fields the poppies blow Between the crosses, row on row, That mark our place; and in the sky The larks, still bravely singing, fly Scarce heard amid the guns below. |
|
Currently, investors are caught in an economic “No Man’s Land”2 between the dangers of inflation and fears of recession as the Fed continues to raise interest rates. In the first half of 2022, U.S. equities and fixed income portfolios suffered some of their largest losses in history3 leaving many investors shell-shocked. Just as the poppies returned to Flanders Fields, the decline in the markets is creating opportunities for investors.
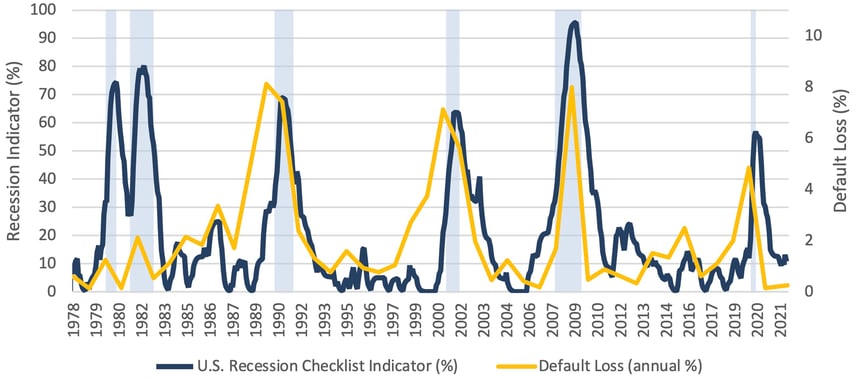
Recessions and Default Losses4
Percentage Change in Profit Margin During Recessions11
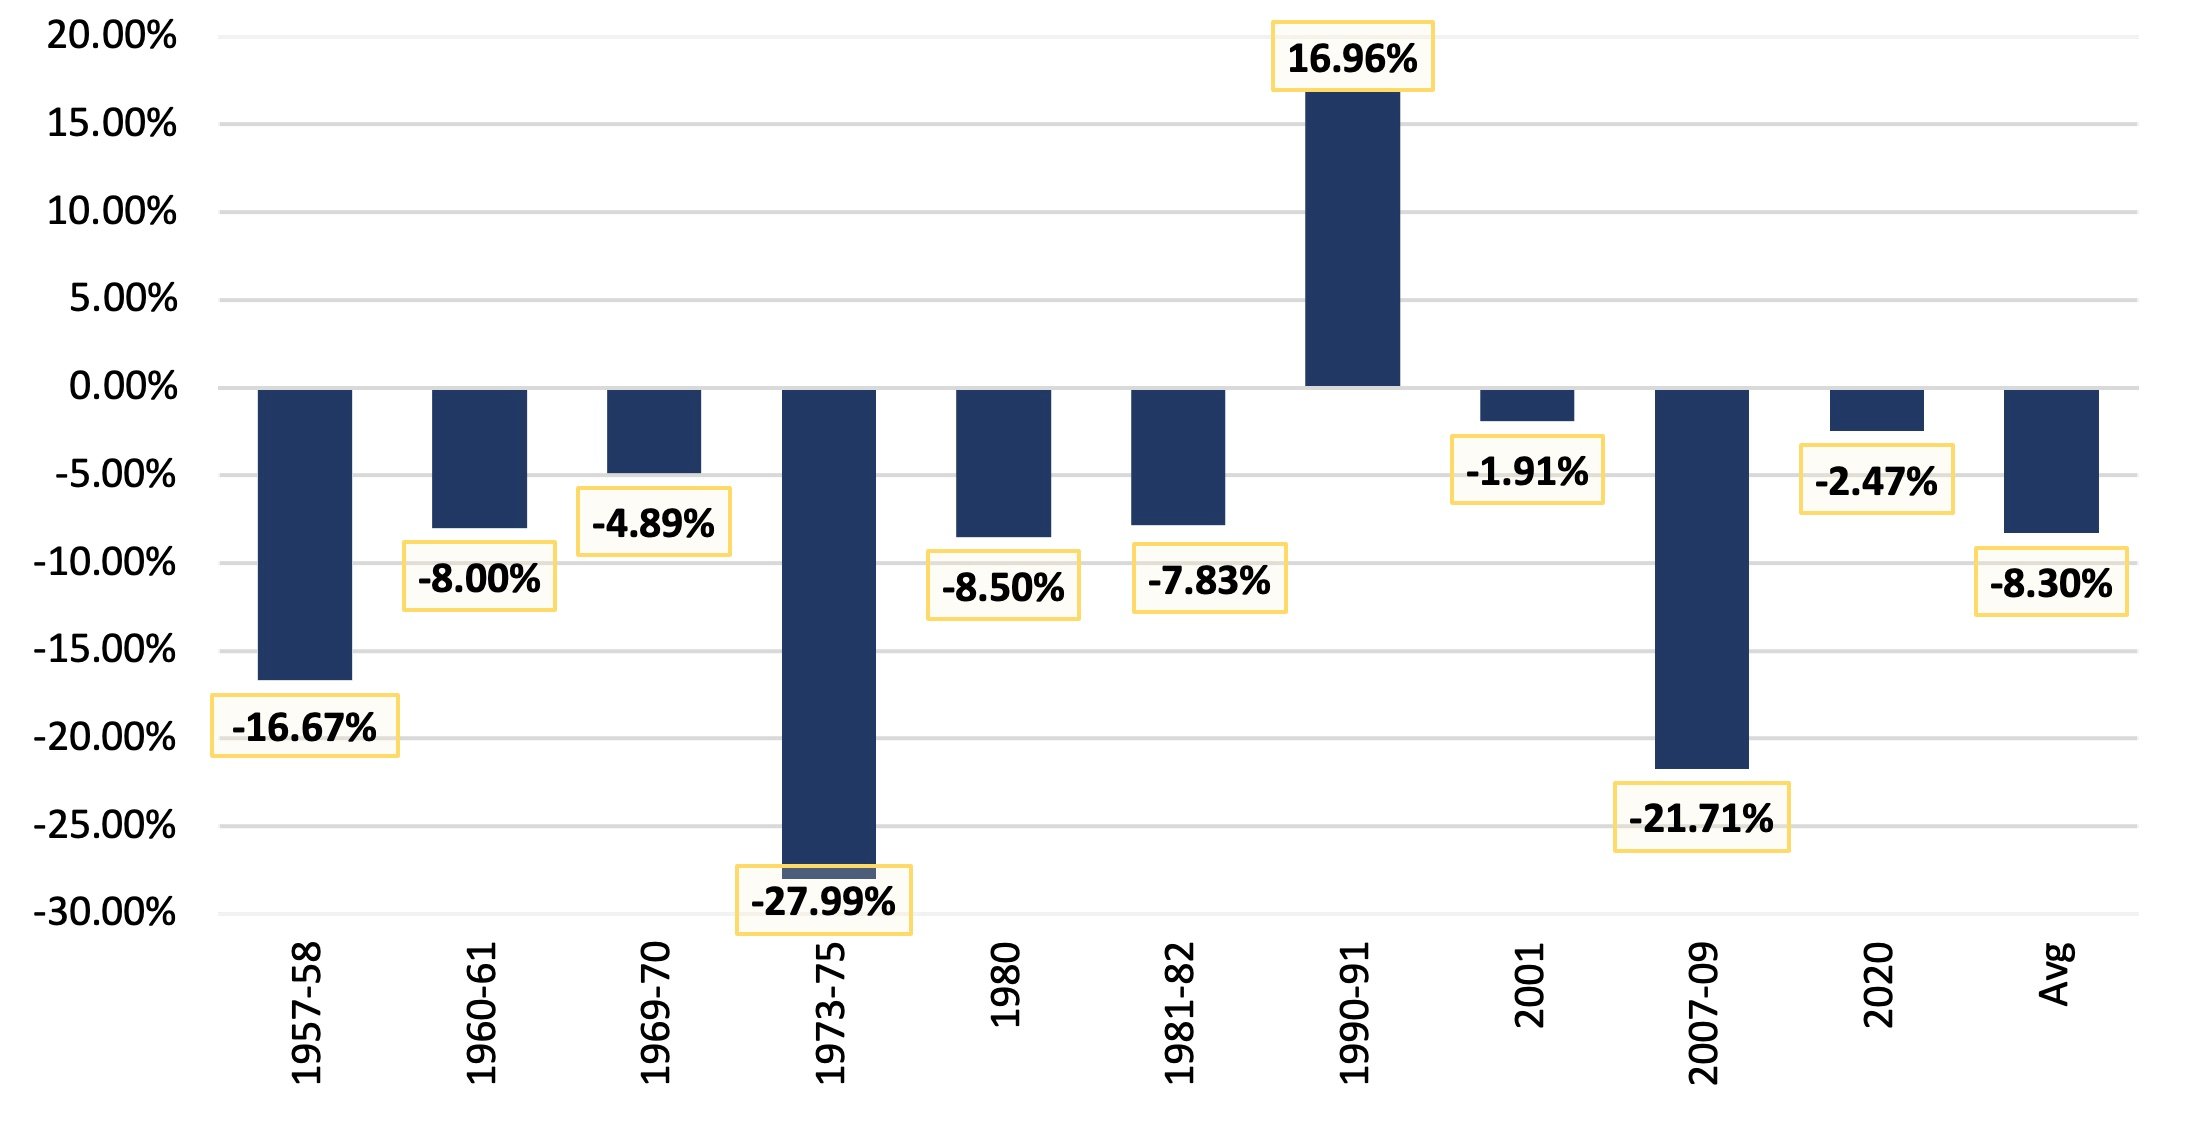
Notwithstanding, a recession would likely lead to reduced corporate profit margins and a decline in cash flow. As shown above, the sharpest decline in profitability occurred in the deepest recessions, the recession of 1973-75 and the Great Financial Crisis of 2007-09. In contrast, profit margins increased in the relatively mild recession of 1990-91 and experienced only modest declines in mild recession of 2001 and the brief COVID-induced recession of 2020. Today, businesses are facing rising input costs due to inflation and supply chain bottlenecks. Although some companies have been able to pass along higher costs to customers, end-user purchasing power, confidence and demand are waning. Case in point, some input and commodity costs are already beginning to adjust downward in anticipation of a slowing economy. Regardless, the decline in profitability will still be inescapable for most companies.
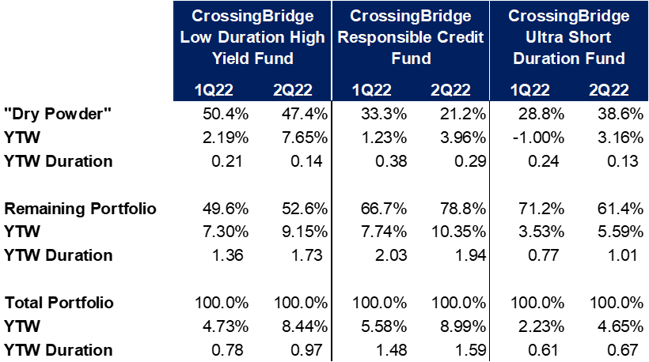
As discussed in previous investor letters, we have been defensively postured in response to the increasingly speculative market and expectation that the Federal Reserve would begin to raise interest rates. The table above shows we have a healthy allocation to “dry powder”12 while the remaining invested portfolio has seen an increase in yield in excess of the move in the Treasury market and duration has remained relatively low. Dry powder affords investors the ability to both withstand volatility and re-allocate capital to invest opportunistically. It is a Wall Street proverb that “nobody rings a bell at the top or the bottom of a market.” Thus, following a significant decline, when one sees the opportunity to capture a good absolute return with an acceptable level of risk, it makes sense to carefully deploy capital in a disciplined manner. We believe that time is now. We recognize that the market may continue to sell-off, leading to mark-to-market losses; however, as long as we do not incur permanent impairments as a result of credit mistakes, these are only “opportunity costs” that should be overcome in the long run.13
In response to the sharp rise in rates that has caused such turmoil in both equity and fixed income markets, some investors are considering liquidating their portfolios at a loss in order to purchase “safe” short-term Treasuries. Our view is that these investors can do better by investing in a portfolio of pre-merger SPACs given that SPAC proceeds (held for the benefit of shareholders) are generally invested in short-term U.S. government bonds.
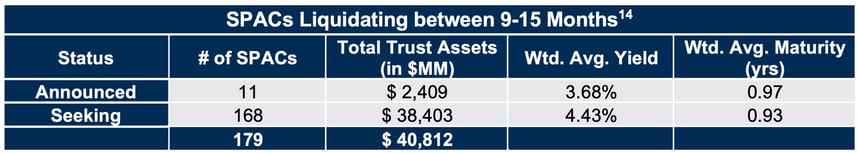
Consider two investors, one who invests in short-term Treasury bonds and another investor who buys a portfolio of SPACs that are seeking merger partners but will liquidate their portfolio of Treasury securities to return their capital to investors if they have not completed a transaction within 9-15 months.15
The SPAC portfolio has a weighted average life of 0.93 years, or nearly one year, and a weighted average yield of 4.43%16 so, if the investment horizon is only one year, the investment in the SPAC portfolio has a return that beats the 1-year Treasury rate of 2.93%17 on 6/30/22 by 150 basis points.
If the time horizon is two years, the investor in the SPAC portfolio will again earn 4.43% for the first year and, therefore, need only earn a return of 1.57% in the second year to outperform an investment in a two-year Treasury, yielding 2.99%18 on 6/30/22.
Lastly, if the time horizon is three years, the investor who holds the SPAC portfolio in year one will only need to reinvest at an annual rate of at least 2.40% over the following two years in order to outperform the three-year Treasury, yielding 3.08%19 as of 6/30/2022.
Further, on an after-tax basis, the total return of SPACs may be more advantageous versus U.S. Treasuries: return on many SPACs will be taxed as capital gains rather than as ordinary income (as is the case with Treasuries).
Unrelated to SPACs, the rise in rates and widening of credit spreads has afforded us the opportunity to deploy our “dry powder” into higher yielding bonds and loans of companies that we believe will be less impacted by either the surge in inflation or a slowing economy. In general, as shown in the following discussions, these are companies that have hard assets that are difficult to replace, provide necessary services, often under long-term contracts, or have upcoming events that are likely to lead to repayment within a reasonable timeframe.
Rockpoint Gas Storage Canada (ROCGAS)20 – Rockpoint Gas Storage is the largest owner/operator of natural gas storage assets in North America. It provides contractual and spot storage services for a wide range of participants in the natural gas market in California, Oklahoma, Texas and Canada, including producers, marketers, power generators, pipelines and municipalities as well as the NYMEX and ICE exchanges. The company also optimizes its capacity utilization by entering into proprietary purchase contracts that are paired with forward sale or hedging contracts to lock in a margin. The company’s facilities play a vital role in balancing the supply of natural gas with demand, which varies both seasonally as well as sporadically due to swings in winter and summer weather. With excellent assets, net leverage21 at a reasonable level at 4.1x, strong ability to generate cash flow and a financially astute equity sponsor, Brookfield Asset Management, holding hundreds of millions of investment capital junior to our secured bonds, we became confident in the credit.
We made our first purchase of Rockpoint’s 7% first lien bonds, due March 31, 2023, in March of 2021 with the expectation that the company would repay the bonds when they became callable at 103.5 on July 2, 2021. We were surprised when the company did not call the bonds at that time, but, apparently, the company’s private equity sponsor determined that a) it did not want to pay a premium to redeem the bonds and b) it thought it might achieve a lower cost of financing if it waited. Confident in the value of the assets and Brookfield’s commitment to the company, we opportunistically added to the position in expectation that the company would redeem the bonds when the call priced declined to par on 3/31/22. Once again, the company surprised us when it did not call the bonds at that time, apparently again because Brookfield was still hoping to achieve a lower cost of re-financing. The rise in interest rates in 2Q22 has caused the company to defer the bond refinancing again, although it will likely be opportunistic if rates and credit spreads recede. This has created an opportunity for us, however, as, with the bond price falling back from par to trade as low as 98, to yield as much as 9.375%, we were active buyers throughout the quarter. Following the company’s release of its Fiscal 2022 results (year ended 3/31/22), the company announced that it generated excess cash during the year, requiring that it tender for a portion of the outstanding bonds at par. We are likely to sell some of our position into the tender in order to capture the discount to par, after which we will consider replacing the tendered bonds via additional market purchases.
Inmarsat (ISATLN)22 – Inmarsat is a British satellite telecommunications company offering global mobile telephone and data services via a constellation of 14 geostationary satellites and associated ground stations. The company delivers voice and broadband communication, remote monitoring and control, and emergency and military communications to customers in a wide range of industries, including aviation, maritime, government, energy and agriculture. Supporting mission-critical business and government applications, the company has long-term contracts with most customers making for good visibility with respect to future revenues. Moreover, given that the satellite system and supporting infrastructure is already in place, capital expenditures are limited, providing the opportunity to grow cash flow to permit investment for growth as well as the ability to de-lever. Given the vital role the company plays and net leverage at a reasonable 5.2x, we became comfortable with the credit and initially purchased the company’s 6.75% first lien bond, due October 1, 2026, in February 2020 at approximately a 5.21% yield to the October 2024 call. With the advent of COVID in March 2020, the bond’s yield briefly spiked over 11%, but retraced back toward 5% by year-end. In 2021, the yield remained in the 5.5-6.0% range, but since the beginning of 2022, has risen with rates and credit spreads to a yield-to-worst above 9%, where we bought it during 2Q22. On November 8, 2021, the company announced that it was being acquired by Viasat, a U.S. provider of satellite services similar to Inmarsat. On a stand-alone basis, Inmarsat’s net leverage has declined from 4.6x at the time the deal was announced to 4.1x at 1Q22 on the strength of EBITDA growth and higher free cash flow. Pro forma leverage for the combined company will initially be 5.0x, but, per Viasat’s projections, is expected to decline to 4.0x by the end of 202423. As the Inmarsat bond does not have a change of control put, Viasat is assuming the bond and it will remain outstanding, retaining the benefit of its first lien on the Inmarsat assets, post-transaction. Our confidence in the bond is further supported by the fact that, in February 2022, Standard & Poor’s put it on Watchlist for a rating upgrade from its current B+ level. Lastly, pending the resolution of long-running litigation concerning the ability of Ligado Networks, a satellite communications company, to use certain radio frequency spectrum, Inmarsat may be entitled to as much as $1 billion that would likely be used to reduce debt, thereby further improving the credit quality.
Stolt-Nielsen (SNINO)24 – Stolt-Nielsen is a Norwegian provider of bulk-liquid logistics and storage and a distributor of bulk liquids and chemicals, with the world’s largest fleet of chemical tankers, a global terminal network and over 43,000 tank containers. The company is also an investor in transport infrastructure for liquified natural gas and a leader in sustainable land-based seafood production. Stolt has experienced cumulative average growth in revenue and EBITDA of 9.1% and 10.3%, respectively, since 2015 with 2021 revenue and EBITDA margin rebounding above the pandemic-impacted 2020 levels. This has facilitated a reduction in net leverage from 5.1x in 2017 to 4.3x at the end of 2021 with further de-leveraging expected in 2022 through free cash flow generation. Confident in the quality of its assets, its key role in global logistics for bulk-liquid and its improving credit quality, we have been involved with the company’s bonds for several years. During 2Q22, we began buying the 6.375% senior unsecured bonds due September 21, 2022 at a yield to maturity in the 6-7% range. The company has more than enough cash on its balance sheet to retire the bonds but appears likely to repay them at maturity. Ordinarily, we would not see bonds with such a short maturity and high probability of repayment offered for sale. However, with the bonds denominated in U.S. dollars, Norwegian funds that hedge their positions back into Norwegian kroner have become forced sellers as the sharp rise in the U.S. dollar has caused them to face margin calls on their currency swaps. This has provided us the opportunity to accumulate a significant position at an attractive short-term yield. To further enhance the rate of return, we are considering offering the issuer the opportunity to purchase our position at a price that would provide us with a capital gain but would also be advantageous for the company relative to the interest cost of its bank facility.
Just like the bursting of the telecom bubble in 2001 and the mortgage crisis of 2008-09, the sharp declines seen in the markets recently have been the result of excess. In the current instance, it has been the product of an excess of liquidity provided by the Federal Reserve and fiscal stimulus provided by Congress in response to the COVID-19 crisis. It has also been caused by excessive speculation as exemplified by individual investors seeking quick riches via cryptocurrencies, meme stocks and pre-revenue, capital-chewing companies.
Still, this has not been some unusual cataclysmic event, granted that the war in Ukraine has exacerbated the situation.25
This bear market is providing opportunities for investors with capital ready to deploy. “High Yield” is once again “high” with the yield for the Bloomberg U.S. Corporate High Yield Index at 8.89%, its highest quarter-end level (but for the COVID-induced spike at 1Q20) since September 2011. Yields for companies that are over-levered or are pursuing questionable business models have risen, but in so doing, have pulled yields wider for good credits with predictable cash flows, solid assets and better balance sheets. These are the fertile fields where we will be looking to find the poppies growing.
Going “over the top,”26 our senses acutely aware of the “whizz bangs”27 while we pick a bouquet of poppies,

David K. Sherman and the CrossingBridge Team
Postscript
Following up on credits profiled in our 1Q22 investor letter, we provide the table below:
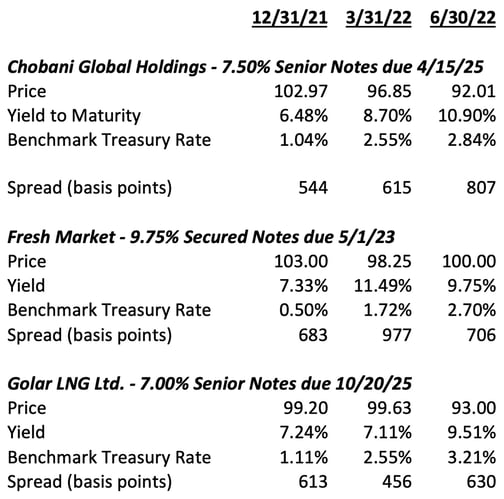
Prices for Chobani and Golar have fallen, primarily due to a rise in Treasury rates and a widening in credit spreads generally. We continue to believe in the investment merits of both of these bonds, as discussed in our 1Q22 investor letter, and look at the decline in their prices as an opportunity to add to these positions at attractive yields. With respect to Fresh Market, we had expressed our concern about the manner in which the company might refinance the bond given its relatively near-term maturity (5/1/23) and, having concluded that the credit metrics were in order, added to our position below par when other investors sought liquidity. To our surprise, on May 10, 2022, the company announced that it was repaying the bonds in conjunction with the sale of a 67% equity stake to a Chilean retail conglomerate. As such, the bond was quoted at par at quarter-end and was repaid at par on July 5, 2022.
Endnotes:
1In Flanders Fields is a poem written in May 1915 by Canadian physician Lieutenant-Colonel John McCrae inspired by the funeral of a friend and fellow soldier who died in the Second Battle of Ypres. The title refers to a major battle theater of World War I from 1914 to 1918 in which a million soldiers from more than 50 nations were wounded, missing or killed in action. The title has become a reference to the senselessness of war, with the poppy, which grew on the battlefields of Flanders, becoming a symbol of remembrance of soldiers who have died in battle.
2“No Man’s Land” is term that originated in the Middle Ages to denote an area of disputed territory which became more commonly used during World War I to describe the terrain between opposing armies and their trench lines. https://encyclopedia.1914-1918-online.net/article/no_mans_land
3In 1H22, the S&P 500 price declined -20.6%, its worst first half performance since 1970. Investment grade bonds, represented by the ICE BofA US Corporate Bond Index, declined -13.93% in the first half of the year, their worst first half ever and the worst six-month period since 1Q80 (-16.35%). The ICE BofA US High Yield Index, which declined -14.04% in the first half, had its worst first half ever and worst six-month period since 4Q08 (-25.43%) (Source: Bloomberg)
4MRB Partners, Federal Reserve Bank of St. Louis, NYU Stern School of Business (1978-84 default losses), J.P. Morgan (1985-Present default losses) (n.b. there may be minor differences in the calculation of default losses in 1984 and prior versus subsequent periods)
5Lehmann, Livian, Fridson Advisors LLC
6Bloomberg, S&P Capital IQ, Morgan Stanley, Bureau of Economic Analysis, NIPA/Haver Analytics, Oxford Economics
7Global Credit Trader - New wides, same challenges, Goldman Sachs, June 30, 2022
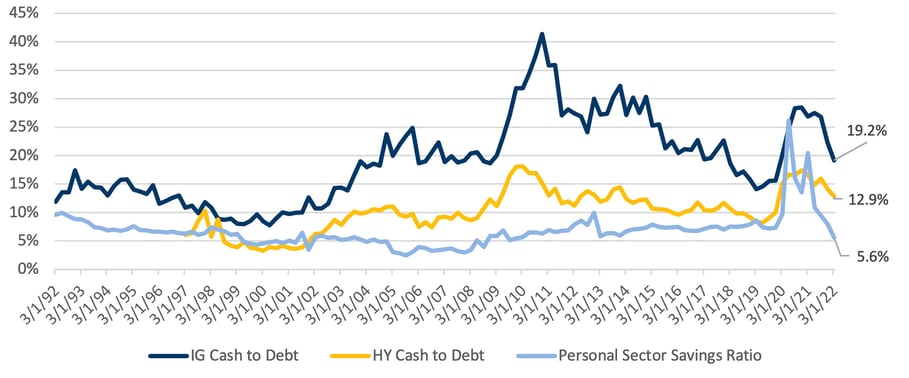
8For investment grade debt, the mean ratio of cash to debt, since 1992, is 19.2%, and the standard deviation is 7.5%. For high yield bonds, the mean cash to debt ratio, since 1997, is 10.2% and the standard deviation is 3.7%. The Personal Sector Savings Ratio (personal savings divided by disposable income), since 1992, has had a mean of 6.7% and standard deviation of 3.0%.
9Bloomberg, S&P Capital IQ, Morgan Stanley, Bureau of Economic Analysis, NIPA/Haver Analytics, Oxford Economics.
10Global Credit Trader - New wides, same challenges, Goldman Sachs, June 30, 2022
11MicroEdge – Microstrategy: Rising Margin Risks – June 2022 Wrap, Jefferies, July 5, 2022; Federal Reserve Bank of St. Louis; Profit margin is defined as Corporate Profits After Tax divided by Gross Domestic Product. The change noted is the percentage decline in profit margin from the quarter preceding the beginning of the recession to the trough margin during the recession. For example, the recession of 2001 began in April of 2001; the profit margin at the end of the prior quarter was 5.616%. The profit margin troughed during the recession in the June quarter of 2001 at 5.509%, resulting in a 10.71 basis point decline or a decline of 1.91% (i.e. -0.1071% divided by 5.6160% equals -1.9071%)
12“Dry powder”, in the context of our portfolios, is defined as cash and investments that are expected to be repaid within 90 days as well as pre-merger SPACs that can be sold at or close to liquidation value. The liquidation value is the amount of cash and short-term securities held in a SPAC’s trust that is to be invested in a target company, distributed to shareholders who elect to redeem their shares for cash rather than invest in a proposed transaction or returned to shareholders at the liquidation date if the SPAC fails to find a merger partner. The “dry powder” category includes securities such as called bonds and debt maturing in less than 30 days. Called or maturing bonds with an ultra-short period to redemption may provide a misleading representation of portfolio metrics due to the potential large impact on yields from minor pricing variances versus the upcoming redemption price. Investments represent a snapshot of a specific point in time and may not reflect future positioning. For example, the “dry powder” yield for the CrossingBridge Low Duration High Yield Fund was 9.12% on 6/30/22, which is an accurate snapshot of the yield at quarter-end. However, as described above, there was a called bond, Tenet Healthcare, that was being redeemed out on 7/1/22. On 6/30, the bond was priced at a 165.58% yield for the 1.33% position, adding significant yield to the portfolio. If you zero-out the yield for the Tenet Healthcare position, the dry powder yield for the CrossingBridge Low Duration High Yield Fund would have been 3.08% as of 6/30
13With respect to corporate bonds, a permanent impairment is a loss of principal resulting from the issuer becoming distressed due to excessive leverage and/or a sharp decline in operating performance. A mark-to-market loss, considered temporary, is caused by a rise in interest rates and/or credit spread which causes the price of a fixed income instrument to decline, but does not imply heightened credit-specific concern with respect to a full recovery of principal and receipt of all interest due. A mark-to-market loss may be considered an opportunity cost in that the decline in the bond price represents a lost opportunity to purchase the bond at a higher yield.
14www.SPACinformer.com; SPACinformer.com is owned by eBuild Ventures, an affiliate of Cohanzick Management, LLC.
15If a SPAC identifies a merger partner prior to liquidation, investors in the SPAC shares will have the opportunity to redeem their shares for the cash liquidation value prior to the close of the merger, increasing the rate of return of the investment.
16www.SPACinformer.com; SPACinformer.com is owned by eBuild Ventures, an affiliate of Cohanzick Management, LLC.
17Bloomberg
18Bloomberg
19Bloomberg
20As of 3/31/2022 our position in Rockpoint Gas Storage represented 2.01% of the Low Duration High Yield Fund, 1.92% of the Ultra-Short Duration Fund, and 3.86% of the Responsible Credit Fund. As of 6/30/2022 our position in Rockpoint Gas Storage represented 3.26% of the Low Duration High Yield Fund, 3.15% of the Ultra-Short Duration Fund, and 5.09% of the Responsible Credit Fund.
21Net leverage equals total funded debt less unrestricted cash, divided by EBITDA.
22As of 3/31/2022 our position in Inmarsat represented 0.00% of the Low Duration High Yield Fund, 0.00% of the Ultra-Short Duration Fund, and 0.00% of the Responsible Credit Fund. As of 6/30/2022 our position in Inmarsat represented 0.11% of the Low Duration High Yield Fund, 0.00% of the Ultra-Short Duration Fund, and 1.22% of the Responsible Credit Fund.
23Viasat + Inmarsat Investor Presentation, November 8, 2021
24As of 3/31/2022 our position in Stolt-Nielsen represented 1.83% of the Low Duration High Yield Fund, 0.00% of the Ultra-Short Duration Fund, and 0.00% of the Responsible Credit Fund. As of 6/30/2022 our position in Stolt-Nielsen represented 0.00% of the Low Duration High Yield Fund, 3.01% of the Ultra-Short Duration Fund, and 0.00% of the Responsible Credit Fund.
25For discussion of the direct impact of the Ukraine war on companies’ credit, see our 1Q22 investor letter.
26“Over the top” refers to soldiers emerging from their protective trenches, ready to engage the enemy.
27During World War I, soldiers learned to identify shells by size, effect or sound. “Whizz-bangs” were munitions fired from high-velocity guns that made an identifiable sound but gave soldiers no time to duck out of the way.