
The Fed Funds Rate has risen from practically zero to almost 5% as a result of central bankers’ mission to quell inflation and wring out excess liquidity. Speculators and borrowers dependent on nearly “free” money, have been left high and dry. The tide has gone out.
![]()

Tide Pools
The Fed Funds Rate has risen from practically zero to almost 5% as a result of central bankers’ mission1 to quell inflation and wring out excess liquidity. Speculators and borrowers dependent on nearly “free” money, have been left high and dry. The tide has gone out.
MRB Partners Inc© The Fallout from a Higher Cost of Capital2
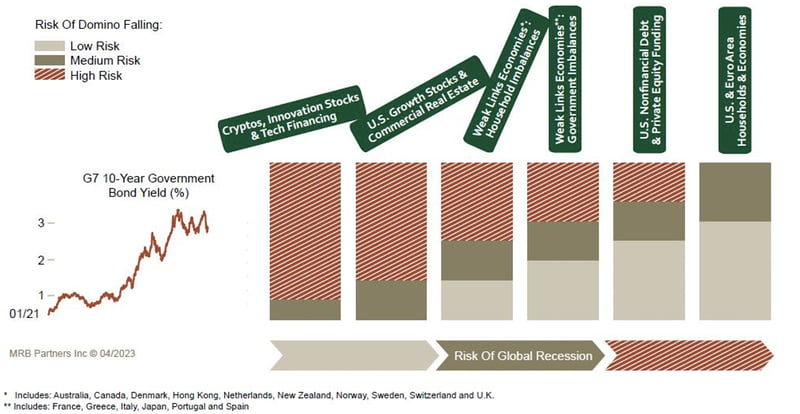
As a paid-up subscriber to MRB Partners’ investment strategy service3, we felt their illustration of “the fallout from higher cost of capital” above was apropos. Asset values have fallen, and capital costs have risen, leaving mark-to-market losses for many investments. Prudent asset/liability management4 will determine whether these losses are realized. Investors that need to liquidate will suffer permanent impairments.5 Borrowers that can refinance their debt as it comes due will survive, but their future earnings will be significantly impacted. Those that can’t refinance will need to restructure – the modern version of “debtors’ prison”. The quick fix would be for interest rates to be driven back down to their historic lows of the last few years, but this would encourage investors’ animal spirits6 and may reignite inflation, restarting the vicious cycle.
We are primarily bottom-up value investors but cannot ignore macro factors. Although we do not share the same level of concern as “Mr. Market” with respect to an immediate distressed credit cycle or deep recession, we are focused on the next domino that is falling – commercial real estate (CRE).7 We believe a significant factor in determining the CRE outcome, both in speed and severity, will be market liquidity and lenders’ willingness to “amend and extend”. Ultimately, the sheer size of CRE may require government intervention similar to the RTC8 established to deal with the S&L crisis of the 1980s.
Companies need low-cost capital like fish need water to breathe.
U.S. Treasury Curve9
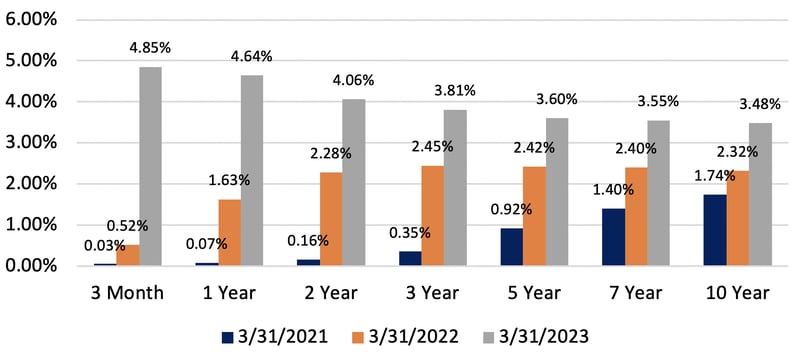
Over the past three years, companies took advantage of low interest rates with aggressive borrowing, refinancing and/or acquisitions. In addition, the steep yield curve between short- and long-term rates encouraged floating rate financings (often requiring interest rate caps or swaps to be purchased10) over fixed rate debt. Fast forward to today, there is a looming wall of interest rate repricing as maturities approach and the interest rate hedging for floating rate liabilities begin to expire. For example, the graph above suggests that refinancing a three-year bond that was issued in 1Q21 with a new three-year bond will cost an additional 346 bp (assuming no widening in credit spreads11). Similarly, refinancing a floating rate loan, the interest rate for which was based on LIBOR12 plus a credit spread, will also be significantly more costly.13 In addition, the amount of debt that may be incurred by a borrower is often limited in the credit markets based on the interest coverage ratio (ICR) reflecting the ability to service the debt. Higher interest rates reduce the ICR, in turn, reducing the acceptable amount of debt. In a higher interest rate environment, the value of the underlying asset (assuming cash flow remained static) will have also declined. Thus, equity holders will absorb the decline in asset value and any portion of the debt that cannot be refinanced. Without enough equity cushion underneath the debt and no new sources of capital, lenders may also suffer losses. The rise in rates reveals the unsteady underpinnings of capital structures premised on interest rates remaining low.
CRE: Change in Rates vs Valuation and Credit Quality14
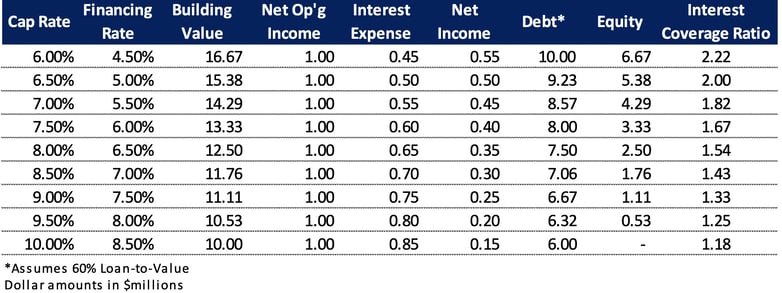
The table above is an illustration showing the reduction in equity value and credit quality resulting from a rise in interest rates and/or credit spread as applied to a hypothetical CRE investment. The increase in rates causes both the cap rate15 and the cost of financing to rise. Assuming a constant 60% loan-to-value, valuation and permitted borrowing capacity decline. Assuming a constant credit spread, highly unlikely in today’s environment, the debt service coverage ratio deteriorates. As the table above illustrates, a 400 bp rise in coupon would completely wipe out the equity while the debt would lose 40% of its value.
Wall of Worry16
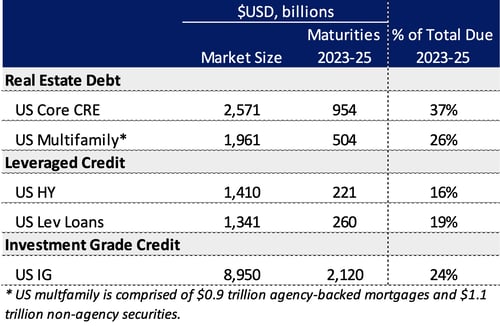
We expect CRE will become the “poster child” for the devaluation and decline in credit quality throughout all of fixed income. Notably, these problems are being compounded by the fact that more than $1.4 trillion of the commercial and non-agency multi-family real estate debt, nearly one-third of the market, faces the prospect of refinancing 2023-25 maturities in a much higher rate environment. In many instances, real estate investors will need to put up additional capital, successfully restructure their debt or “hand over the keys” to lenders. Post-COVID, office properties are most at risk due to the shift to hybrid/remote work. In February 2023, Brookfield walked away from $784 million in loans on two trophy Los Angeles office towers17 and, in March 2023, Blackstone defaulted on a €531 million bond backed by European offices and stores.18 This is not just a U.S. problem, but a world-wide problem. For a sense of scale, the US Core CRE market is nearly as large as the entire U.S. high yield and leveraged loan market.
Another domino we are carefully watching is the corporate credit market. High yield, leverage loan and investment grade corporate issuers have debt maturing within the next three years representing 16%, 19% and 24%, respectively, of total outstanding. The maturity wall is clearly less severe. Yet, a similar effect is occurring; issuers are feeling pressure as their interest cost rises. For borrowers with high leverage, an inability to refinance at acceptable rates may lead to restructurings.
The outgoing tide exposes rotting foundations.
The banking crisis observed over the last several weeks is far different from the S&L crisis (1989-95) and the Great Financial Crisis (2008). Those crises were rooted in fundamentally bad underwriting and the behavior of aggressive lenders taking advantage of lenient banking rules and lax regulatory oversight. The current crisis results from banks doing what banks do – borrowing short-term to lend long-term. This asset/liability mismatch is one of the “dirty little secrets” of banking that investors, depositors, and regulators have come to live with. In a rapidly rising rate environment, however, this portfolio management strategy holds two primary dangers that led to the failure of Silicon Valley Bank (SVB) and have raised concerns about other banks. First, as interest rates rose, depositors began to withdraw their funds to reinvest in money market funds and other instruments that paid a higher rate. From the end of 1Q22 through year-end 2022, SVB’s deposits declined by $25 billion or 13%.19 Second, the rise in interest rates caused the market value of government and mortgage-backed securities in which it had invested to decline. Although these securities were in all likelihood “money good”20 if held to maturity, SVB chose to raise cash in order to meet depositor withdrawals by selling these securities, crystalizing mark-to-market losses. Thus, the rise in rates both precipitated the need to raise cash and the losses in their bond portfolio, ultimately leading to a “run on the bank”. These events have led to increased scrutiny of regional banks and only time will tell how this plays out, but we are sanguine (not so much with respect to the “shadow” banking system21, a conversation for another time).
NY Fed's Corporate Bond Market Distress22
(1 = most distressed)
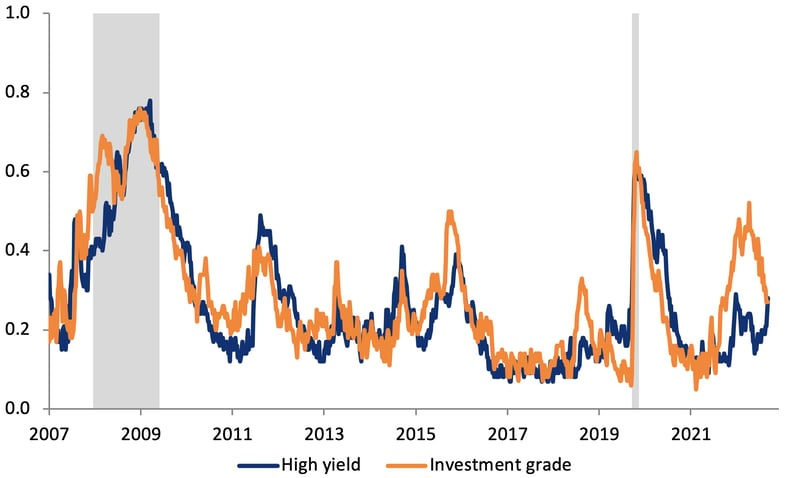
Each distress cycle is unique, finding its focal point depending on the specific circumstances: excess valuation, aggressive lending, industry-specific factors, or over-investment. Sometimes they are precipitated by a recession, war, or a failure in confidence. In most cases, liquidity drying up was a precursor. The severity and length of the distress cycle is highly dependent on the response of the capital markets and return of liquidity. Similar to falling dominos, distress in one asset class can easily lead to distress in others as capital migrates to the best opportunities. The increasing distress in the commercial real estate market may drive prices down and yields up in the corporate credit market. The level of corporate bond market stress is not unusually high at this time, albeit elevated from the recent period of cheap money.
U.S. Leveraged Loans23
(Net Leverage and Interest Coverage)
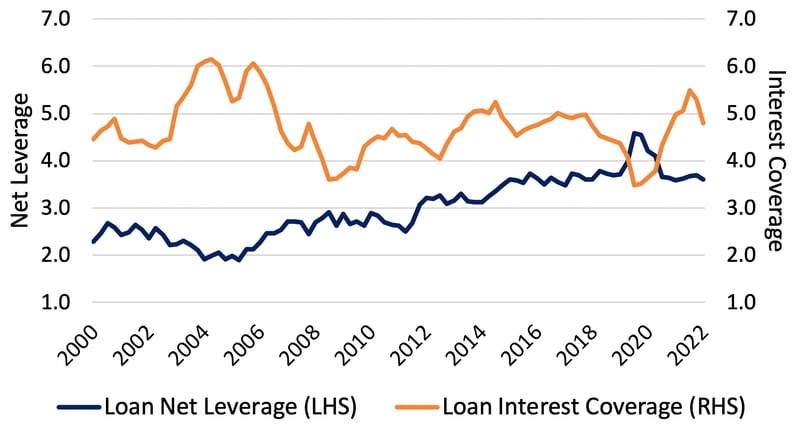
The below-investment grade corporate debt market, as reflected in the credit fundamentals for leveraged loans is in reasonable shape. Net leverage, on average, is about 3.6x EBITDA and interest coverage is very strong at 4.8x. Note that the interest coverage ratio incorporates the rise in interest rates as these instruments typically have floating rate coupons.
Implied Overnight Rate & Number of Hikes/Cuts24
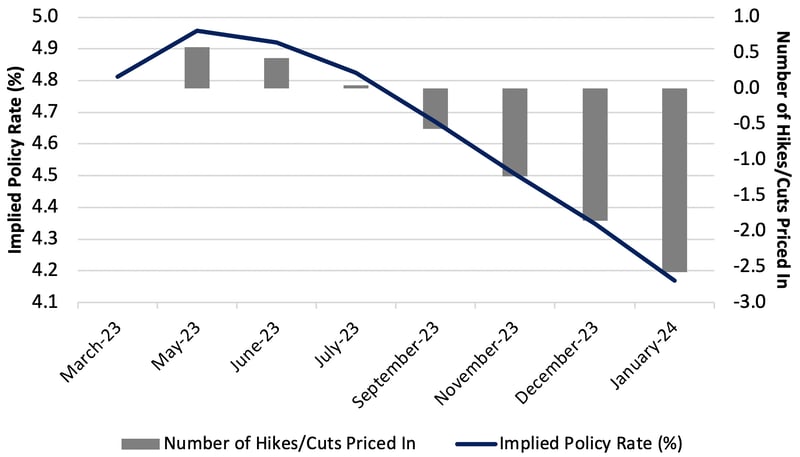
In prior letters we have discussed the opportunities we were seeing in floating rate debt. Floating rate debt has two components to its coupon, a base rate that typically resets monthly or quarterly and a fixed credit spread. For example, a loan might have coupon that is SOFR + 450 bp payable quarterly in which SOFR will adjust every three months and was 4.87% on March 31, 2023. Adding the 450 bp credit spread results in an effective coupon of 9.37%. However, the computation for yield to maturity in comparison to a fixed coupon bond is based off a forward curve predicting future SOFR rates. The chart above implies that the Fed Funds Rate will decline by 52 bp to 4.35% by December 2023 which would restrike the effective coupon to 8.85%. If the implied rate declines are smaller or take longer, the loan will earn yield in excess of expectations – a windfall for the investor.
Total Floating Rate Exposure25
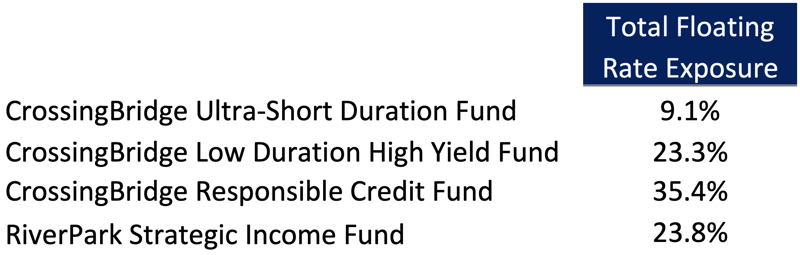
The portion of floating rate debt in our portfolios remains elevated. We continue to believe that rates will remain higher for longer barring systemic risk. Hence, our floating rate debt exposure should allow us to capture the benefit of the market’s forward curve mispricing. This is extra cushion and yield if we are correct. An example of a fine credit in which we believe the floating rate debt offers better risk-adjusted return than the fixed rate bonds is Getty Images.26 The company’s first lien term loan, with a coupon equal to the 3-month Treasury rate plus 450 bp and due 2026, has a current effective coupon of 9.46%. This compares to Getty’s unsecured bond due 2027 which has a coupon of 9.75%. At quarter-end, both the bond and the loan traded around par.27 Assuming that the three-month Treasury rate does not change, the secured loan will have a yield similar to the unsecured bond but resides higher in the capital structure providing better credit protection. Granted, if rates fall, the yield on the loan will decline while the bond would likely appreciate, but the level of appreciation will be limited because the bond may be redeemed by the company prior to maturity allowing Getty a benefit similar to a homeowner refinancing their mortgage at a lower rate. In the case of the bond or the loan, we are quite comfortable with Getty’s credit profile, and we are mildly amused that an activist investor28 is stirring the pot with the belief that the stock is worth nearly double its current market price.
There are good things to see in the tide pools and there are exciting and interesting thoughts to be generated from the seeing. – John Steinbeck
Infrabuild Australia Pty (INFRAB) 12.00% First Lien Notes due 10/1/2429 – Infrabuild is Australia’s largest vertically integrated producer of steel “long product” (bars, beams, rebar) produced via electric arc furnaces and its second largest recycler of steel scrap. The company is wholly owned by GFG Alliance, a multinational producer of steel, aluminum, and renewable energy. GFG has been experiencing financial distress as a result of its borrowing relationship with Greensill (UK). However, Infrabuild is the “crown jewel” of GFG and, since it issued its bonds in 2019, has had no relationship with Greensill. Further, we became comfortable that GFG’s issues were unlikely to affect the Infrabuild bonds as they are secured by all of Infrabuild’s Australian assets and the bond indenture contains strong covenants, limiting the ability of GFG to take out dividends or issue significant incremental debt that might negatively impact the credit. As a result of very strong performance in 2022, net leverage (net debt divided by EBITDA), based on the last 12 months ended December 31, 2022, is 0.70x. Should the company continue to perform as it has, cash flow from operations should be sufficient to repay the bonds. If cash flow reverts to the levels of 2019 and 2020, net leverage would only deteriorate to less than 2.5x. Infrabuild’s strong credit statistics, solid bondholder protections and the parent company’s desire to preserve value, led us to begin purchasing the bond in November of 2022 at 94.50 for a yield-to-maturity of 15.40%. Our comfort with the credit has grown through several phone calls with management and an in-person meeting with them in February, leading us to add to the position through numerous purchases, the last in February at 97, for a yield-to-maturity of 14.13%. The company is in the process of acquiring GFG’s North American steel operations at, in our opinion, a slightly elevated value. It is being financed with a new asset-based loan facility under terms similar to their prior ABL facility. Our bonds have a first lien on Infrabuild’ s fixed assets and a second lien on the company’s inventory and receivables. In October 2023, the bonds become current obligations and we believe that the company will look to refinance them prior to maturity.
Talen Energy (TLN) Senior Secured Notes (7.25% due 2027, 6.625% due 2028, 7.625% due 2028)30 - Talen Energy Corporation, through its subsidiary, TES, is one of the largest competitive power generation and infrastructure companies in North America. TES owns and/or controls approximately 13,000 megawatts of generating capacity in wholesale U.S. power markets, principally in the Mid-Atlantic, Texas and Montana. On May 9, 2022, the company filed Chapter 11 Bankruptcy with holders of 62% of unsecured bondholders backing a restructuring support agreement through which $1.4 bn of debt would be equitized, $3.2 bn of debt would be eliminated and certain bondholders committed to backstop a $1.65 bn equity rights offering. The proposed Plan of Reorganization (POR) provided for payment in full of the secured bonds including all pre-petition accrued interest and 40% of the call premium that would be due as of the POR’s effective date. The order approving the debtor-in-possession financing, providing cash to support the company during Chapter 11, also required the company to pay current interest, monthly, to the secured bondholders, subject to certain liquidity tests. Comfortable that the POR would be approved and that the secured bonds would be paid in full in cash by June 30, 2023, we began buying the bonds in October 2022 at yields to the expected exit date in the 8-10% range. The bankruptcy court confirmed the Plan of Reorganization (POR) on December 15, 2022, with the effective date subject to receipt of regulatory approval for the transfer of ownership to the unsecured bondholders. Since our initial purchases, we added to the position, most recently in March when we bought bonds yielding 9-10%. The company received its final regulatory approval on March 31, 2023, and is expected to exit bankruptcy, after completion of its exit financing, by mid-May 2023. Insofar as the time to exit will have been shorter than our expectation, the rate of return on the position is expected to be a bit higher than our initial estimates.
Option Adjusted Spreads by Asset Class31
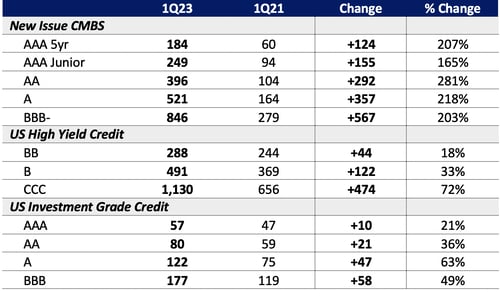
Returning to our “poster child”, CRE, the table above reflects the credit spreads required for new issuance of collateralized mortgage-backed securities (CMBS) in the first quarter: AAs have a 108 bp higher spread than BB U.S. high yield bonds, single A CMBS have a 30 bp higher spread than single B high yield credits and BBB- CMBS have a 355 bp yield advantage over single B high yield bonds. The CRE stress and repricing could easily lead to spread widening in corporate debt as capital seeks the best returns relative to risk. Don’t be surprised if our portfolios reallocate some capital to CRE with our credit pencils well-sharpened.
Signing off with a favorite H.G. Wells quote:
Affliction comes to us, not to make us sad but sober; not to make us sorry but wise.

David K. Sherman and the CrossingBridge Team
POSTSCRIPTS:
Since the theme of our letter is “Tide Pools” we want to support the National Marine Sanctuary Foundation (https://marinesanctuary.org/). We are making an initial $1,800 contribution and will match, dollar for dollar, any contributions from our readers that reference our letter until our $25,000 goal has been reached. Please note our affinity for bodies of water as represented by the given names of our funds and investment advisors.32
Endnotes:
1 For more discussion, see the International Monetary Fund’s March 1, 2023 publication, New Worries for Central Bankers by Gita Bhatt
2 MRB Partners, Inc.
3 MRB Partners https://www.mrbpartners.com/
4 Asset/liability management is the process of matching asset holding periods and cash flow streams with future expenses and financing. Often, a mismatch occurs for various reasons. Banks usually borrow short term, via deposits, and lend long via mortgages and other types of loans, creating an inherent mismatch of assets and liabilities.
5 Timing is critical. If investors have an imminent need for cash, they may be forced to sell assets at a loss. If payment of their liabilities can be delayed, asset values may recover or assets may earn out.
6 John Maynard Keynes coined the term “animal spirits” in his 1936 publication, The General Theory of Employment, Interest, and Money, a primary tenet of behavioral economics. For those wishing to dive deeper, check out Animal Spirits How Human Psychology Drives the Economy, and Why It Matters for Global Capitalism, by Akerlof and Shiller. Alternatively, to bypass the 230-page book, see the The Economist’s abstract: How Human Psychology Drives the Economy, and Why It Matters for Global Capitalism
7 This is not to ignore other asset classes that are beginning to fall in value, such as, credit default swaps (CDS) for emerging market sovereign debt which are reflecting increasing expectations of default
8 The Resolution Trust Corporation (RTC) was established to resolve the savings & loan ("S&L") crisis of the 1980s by closing or selling failed financial institutions and liquidating their assets while participating in any market upside that might occur (for more insight: Federal Reserve History Savings and Loan Crisis).
9 Bloomberg
10 Floating rate borrowers are often required by their lenders to purchase interest rate caps or swaps to hedge interest rates. In a rising rate, the cost of these hedges increases. For a more detailed explanation (but not an endorsement), check out a ArborCrowd’s blog “Hedging Interest Rate Caps and Swap” dated July 14, 2022, in their website’s Learning Center for industry terms.
11 The credit spread is the amount of additional interest above the “risk free rate” that a borrower must pay to a lender reflecting the market’s perception of the relative risk of loss for the debt instrument.
12 London Interbank Offer Rate. This is being replaced by the Secured Overnight Financing Rate (SOFR), a rate comparable to LIBOR that is determined daily by the New York Federal Reserve.
13 Bloomberg
14 Internally calculated (it’s just math)
15 The cap rate is the expected yield of a property based on expected cash flow. A property with a cap rate of 5% and net operating income of $1.0 million would have a value of $20.0 million (i.e. $1.0 million divided by 5%). The cap rate is a valuation metric used in the real estate market that is comparable to the P/E ratio (i.e. inverse of the annual yield on equity) and the EBITDA multiple (i.e. number of years of EBITDA earnings to equal enterprise value, implying an earnings yield) in the corporate equity market.
16 Scaling Maturity Walls, Morgan Stanley, April 4, 2023
17 Inside Brookfield’s LA office defaults, The Real Deal, February 23, 2023
18 Blackstone defaults on Nordic mortgage-backed bond, Reuters, March 3, 2023
19 The Banking Crisis: A Timeline of Silicon Valley Bank’s Collapse and Other Key Events, The Wall Street Journal, March 27, 2023
20 “Money good” is a term used by CrossingBridge to describe debt it believes will be paid off in full under current market conditions and on a strict priority basis
21 The shadow banking system is comprised of unregulated or under-regulated institutions that conduct lending activities outside the traditional banking system. Examples of these entities include private credit funds, money market funds, structured investment vehicles (SIVs) and limited purpose finance companies.
22 Federal Reserve Bank of New York
23 Morgan Stanley
24 Bloomberg <WIRP>, March 31, 2023
25 The RiverPark Strategic Income Fund is in the midst of a proxy process. If successful, the RiverPark Strategic Income Fund will merge into a new Fund, which is advised by CrossingBridge Advisors, LLC. The shareholder meeting will be held on May 10, 2023. Data as of March 31st, 2023
26 Holdings for Getty by account 12/31/22, 3/31/23
27 Bloomberg
28 Trillium Capital Issues Open Letter to Getty Images Board, PR Newswire, April 11, 2023. Per their letter to the Getty board, Trillium asserted that the stock was worth $12.58/share. This compares to the $6.50 closing price on April 10, 2023, the day prior to issuance of the letter.
29 Infrabuild position by account 12/31/22, 3/31/23
30 Talen positions by account 12/31/22, 3/31/23
31 Citibank, ICE BofA High Yield Index, ICE BofA US Corporate Index
32 Cohanzick Management LLC is the subadvisor to RiverPark Short Term High Yield Fund and the RiverPark Strategic Income Fund. CrossingBridge Advisors LLC is the advisor to the CrossingBridge Ultrashort Duration Fund, the CrossingBridge Low Duration High Yield Fund, the CrossingBridge Responsible Credit Fund, and the CrossingBridge Pre-Merger SPAC ETF. Cohanzick Management LLC and David K. Sherman are the controlling shareholders of CrossingBridge Advisors, LLC.