The Iceberg Phenomenon1
Scientifically, 10% of an iceberg is visible while 90% of its volume is unseen, below the water’s surface. In the U.S. equity and fixed income markets, the dramatic rebound from the March trough brought this to mind as there is a lot more going on below the surface. We don’t know how long or how much further the broad market will continue to rally, but we are confident that many individual corporate credits will diverge from the market. As bottom-up investors, the tip of the iceberg phenomenon creates opportunity for us.
High Yield Credit Spreads and Economic Uncertainty Index (EUI)2
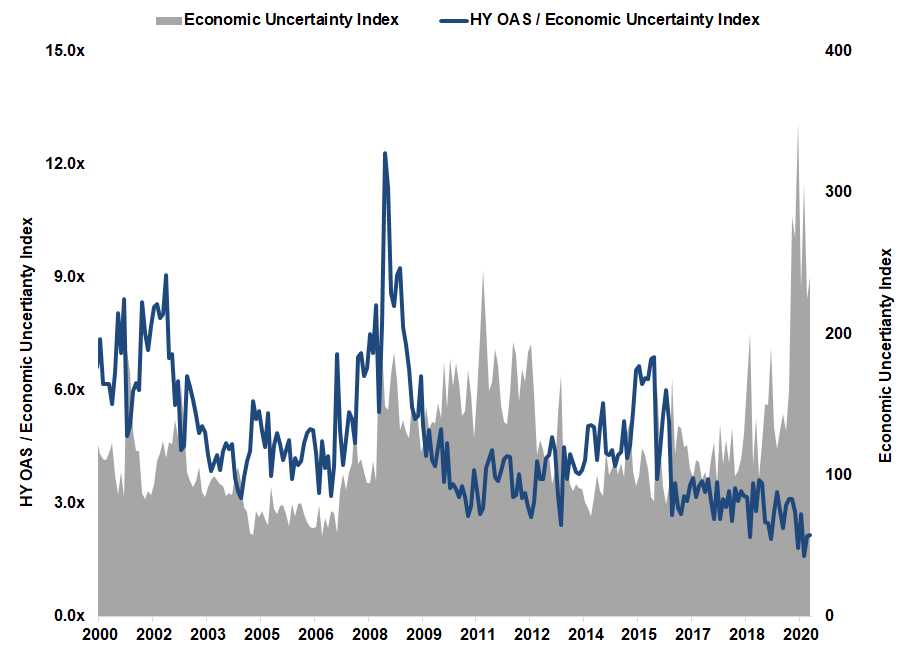
Economic uncertainty as measured by the EUI cited above is at its highest level in 20 years. However, the high yield spread to Treasury relative to the EUI is at the lowest level in 20 years. Effectively, the “junk bond” credit spread divided by the EUI is paying you 2.2 basis points for every unit of uncertainty in comparison to its peak of 12.3 basis points in November 2008. It appears that “Mr. Market” believes that the economic recovery will continue to be robust3, or macro and structural concerns are overstated. Should Mr. Market be wrong, one is not being compensated for “tail risk”.4
Secondary Market Corporate Credit Facility (SMCCF) 2020 HY ETF and Bond Purchases vs HY Option Adjusted Spreads5
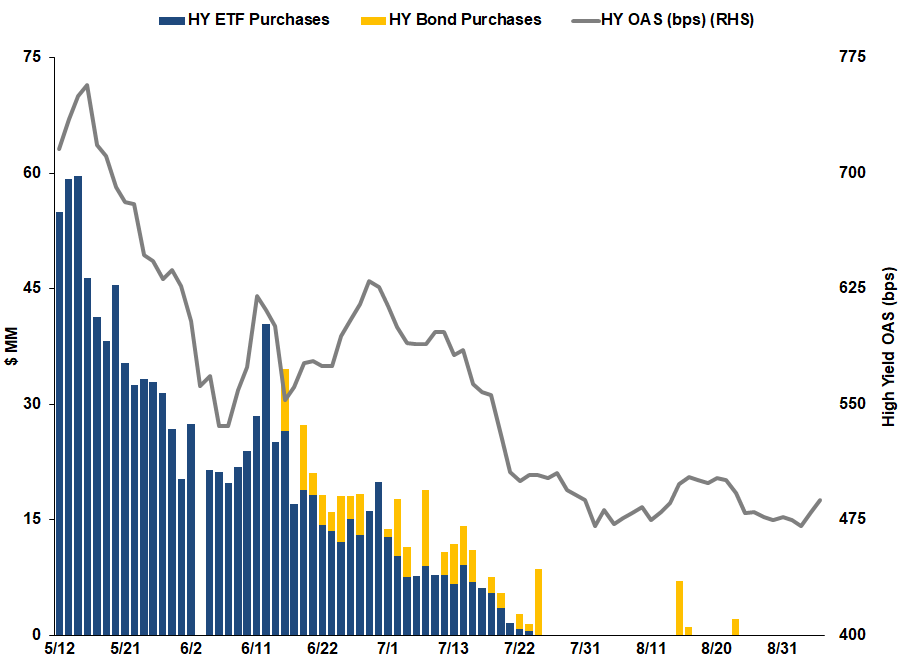
On March 23, 2020, the Federal Reserve established the Secondary Market Corporate Credit Facility (SMCCF) to support the capital markets in the face of the economic shut-down brought on by the COVID-19 pandemic. SMCCF purchases began in mid-May6 and, by the end of June, it owned approximately 2% of the largest high yield bond ETFs and over 4% of the largest investment grade bond ETF7,8. This was very effective9 in calming the markets and establishing investor confidence that the “Fed put”10 had been institutionalized. In aggregate, SMCCF purchases have totaled approximately $13 billion, far short of its $250 billion purchasing capacity, leaving a large portion of “dry powder” for the future.
Investment Grade and High Yield New Issuance11
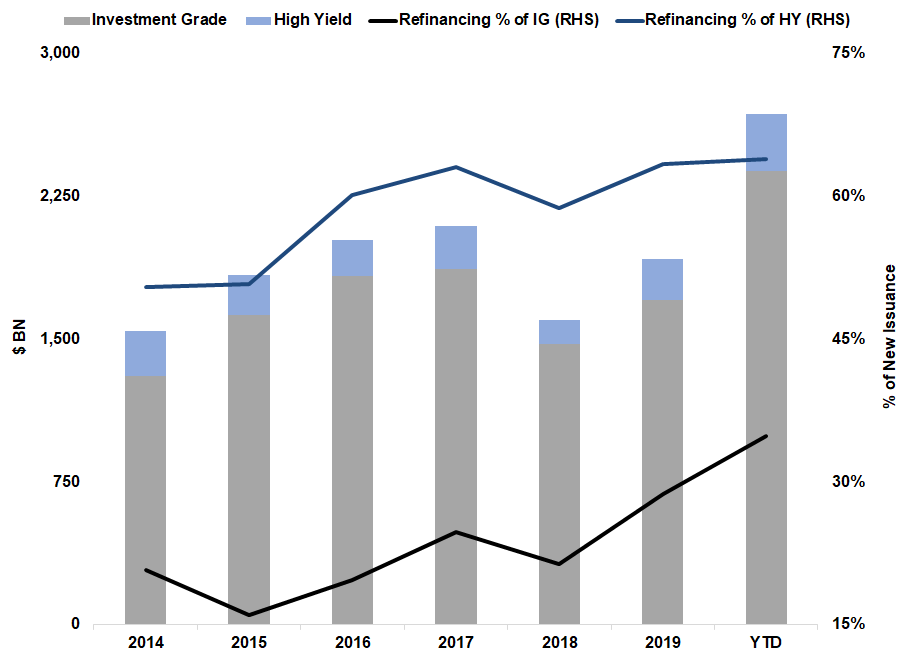
As a result of the Fed’s support, the corporate bond market has been “on fire;” issuance has risen to an all-time high with total new issuance exceeding the previous annual record after only nine months. Issuer motivations range from shoring up liquidity to taking advantage of historic low interest rates. This has been particularly beneficial to the CrossingBridge Low Duration High Yield Fund as it has provided an abundance of opportunities to invest in high yield bonds and “fallen angels”12 that are being called or redeemed.
Cash to Assets13
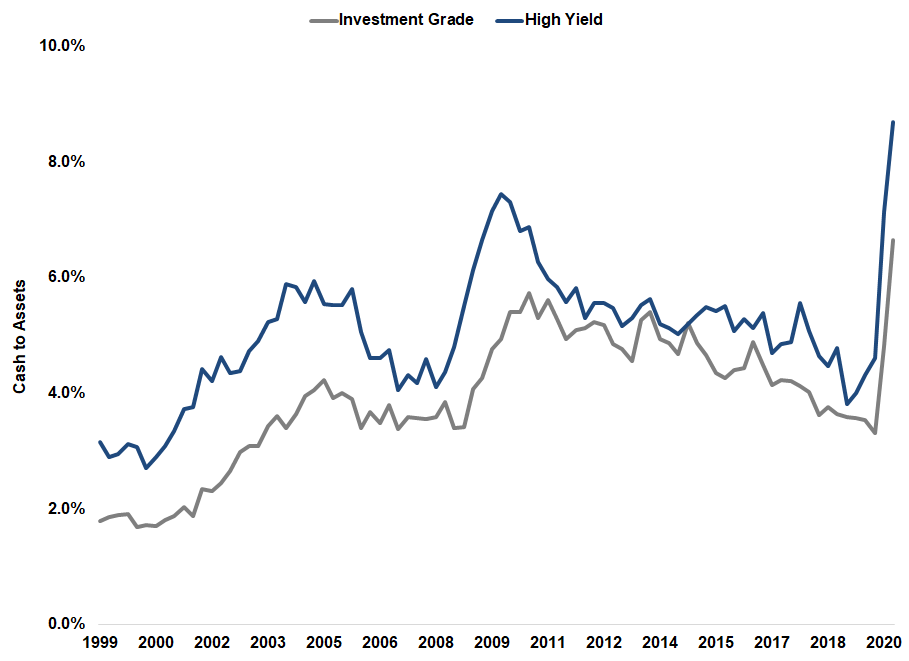
As shown above, cash as a percentage of corporate balance sheets has risen to a 20-year high for both investment grade and high yield issuers. As previously mentioned, contributing factors include expense reductions, inventory liquidations and cash raised via the capital markets to supplement liquidity or cover operating expenses.
Non-Financial Corporate Businesses Debt Securities & Loans as a % of Revenue14
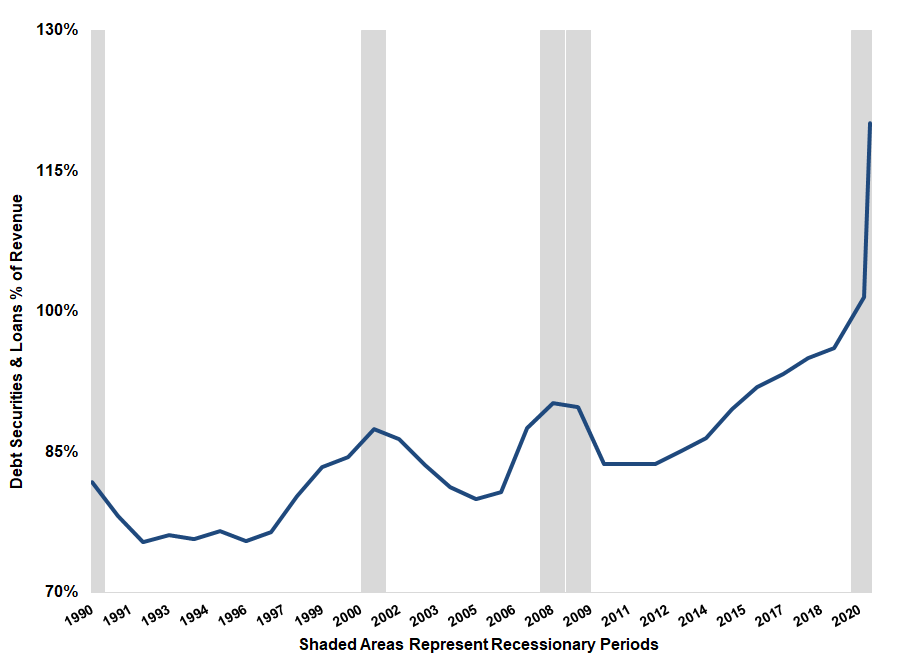
Much of the cash now sitting on corporate balance sheets or used to meet companies’ cash burn was raised through new debt issuance. As of September 30, corporate debt as a percentage of trailing revenue has risen sharply to 120%. The Fed’s programs were successful in preserving access to the capital markets for most corporations.15 But…
Investment Grade and High Yield Leverage Ratios16
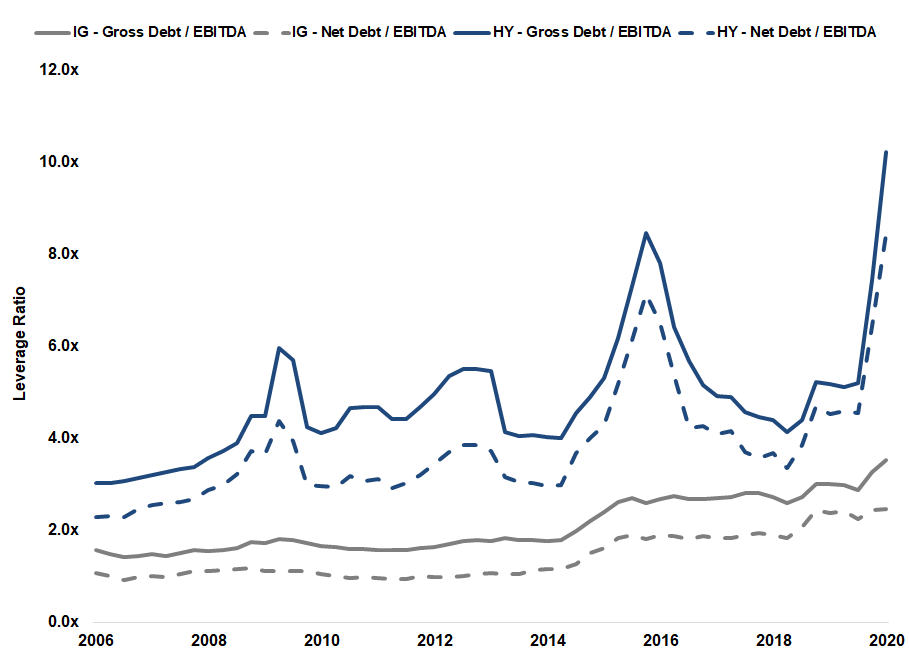
More importantly, the rise in debt issuance and the decline in cash flow due to the pandemic has caused an increase in leverage for both investment grade and high yield credits to levels not seen in at least 15 years. Even netting out cash on corporate balance sheets, leverage is elevated. For some, increasing leverage was a matter of survival or for others it was “just in case we need the money.” As the economy returns to the “new, new normal,” some companies will use the excess cash to repay the debt incurred and the increase in leverage will prove to be temporary. For others, who needed cash literally to keep the lights on while revenues dwindled, this heightened level of leverage may become virtually permanent, potentially creating a new cohort of “zombie”17 companies that are barely able to cover their interest expense, but are unable to repay debt.
BBB and BBB- Debt on Negative Outlook18
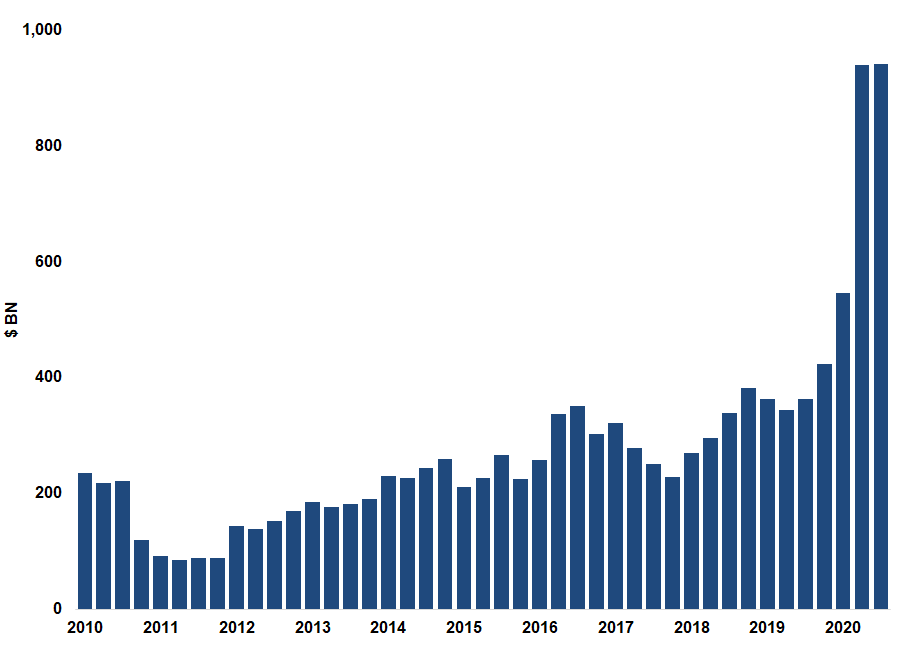
After an initial surge in credit downgrades and “fallen angels” in 2Q20, further credit rating deterioration has moderated. As illustrated above, however, the amount of debt rated BBB and BBB- that is on “Negative Outlook” for potential downgrade at the end of 3Q20 is at historic highs at over $940 billion, over 4 times both the mean and the median for the last 10 years. Further downgrades and defaults are lurking.
Senior Loan Officer Survey of Lending Standards vs. HY Spreads19
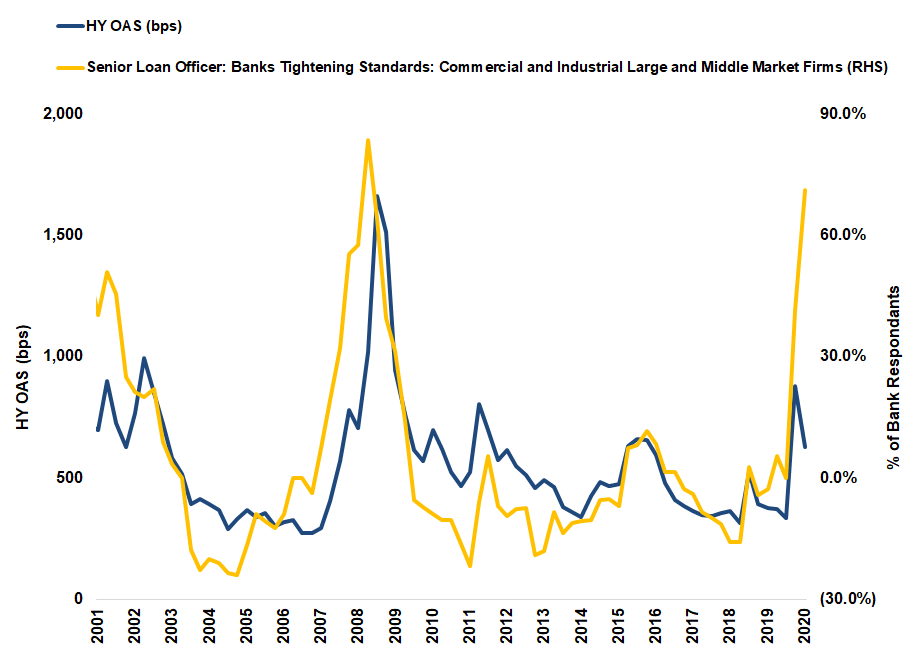
The Senior Loan Officer Survey of Lending Standards, conducted by the Federal Reserve, reflects the availability of loans for large and middle market firms. Historically, the movement of high yield credit spreads have corresponded with credit availability by traditional banks – narrower when credit is widely available, wider when loan officers perceive greater risk. Similar to the disconnect between high yield credit spreads and the level of economic uncertainty, there is also a disconnect between the willingness of commercial and industrial bankers to lend and that of buy-side debt investors (as illustrated by the decline in high yield credit spreads).20 The Fed deserves credit for energizing the corporate bond market, driving down credit spreads at a critical juncture, but the tight lending standards reflected in the Senior Loan Officer Survey suggest that spreads are likely to rise.
Clearly, we believe today’s landscape favors the “bottom-up” investor. Further, we see an increasing divergence between the “haves” and “have nots”, those companies that have easy access to the capital markets and those that don’t. Consequently, the broad fixed income markets will remain reflective of the herd mentality, but we believe that the economic volatility brought on by the pandemic is creating a large opportunity set that will reward investors willing to “roll up their sleeves.”
Below we provide several examples of 3Q20 investments illustrating this point:
- Golden Nugget (NUGGET) – Rescue financing that becomes event-driven opportunity
- Martin Midstream Partners (MMLP) – Out-of-court restructuring transitioning to mainstream high yield bond
- MPC Container Ships (MPCCME) – Activism to protect and create value
Golden Nugget (NUGGET)21 - Golden Nugget is a hospitality company that owns various casinos in Las Vegas, Atlantic City and Lake Charles, LA, restaurant chains Mastro’s and Del Frisco’s and iGaming, an online gaming business. iGaming has been growing at an annual rate of 48% since 2016 and is seeing significantly higher growth of late, likely due to stay-at-home requirements of the pandemic. After closing all of its properties in March, Golden Nugget projected $500 million of annual cash burn. With trailing net leverage of 6.3x and liquidity of $171 million, the company only had enough capital to support it for four months, with bankruptcy a realistic possibility. In April 2020, the company took advantage of its “cov-lite” credit agreement to issue a $300 million 3-year term loan, secured by the iGaming assets, at a 14.5% yield-to-maturity. This bridge financing increased the company’s cash balance to over $550 million to extend its “runway”. In addition to being secured by the iGaming business, the loan is effectively secured by the other Golden Nugget assets on a pari passu basis with Golden Nugget’s existing secured term loan. We participated in the original issuance of this loan. In July, the company announced that iGaming would be sold to Lancadia Acquisition Corp., a SPAC partially sponsored by Golden Nugget’s controlling shareholder. This de-leveraging event, through which Golden Nugget would become a public company, as well as its continuing cash flow growth, created a much-improved credit profile. Thus, we were comfortable purchasing the loan at a yield-to-worst in excess of 7.90%.
Martin Midstream Partners (MMLP)22 - Martin Midstream Partners is a publicly traded master limited partnership that operates in four key business segments: storage, sulfur, transportation and natural gas liquids. It provides specialty services to major and independent oil and gas companies including refineries, chemical companies, etc. with significant business concentrated around the U.S. Gulf Coast refinery complex. Although MMLP is asset rich and diversified, the market tarred the company with the same brush as the energy industry and drove the company’s $400 million of 7.25% senior unsecured bonds, due 2021, from 95 in mid-February to the upper 30s in late April. With relatively stable operating performance, low maintenance capital expenditures and leverage below 5x at year-end 2019, the company, under normal circumstances, would have expected to easily refinance the bond before its maturity in February 2021. However, with the loss of access to the capital markets, the company pre-emptively initiated an exchange offer. Entering a Restructuring Support Agreement on June 26, 2020, the company initiated the exchange on July 9 with the support of holders of 74.3% of the bonds. Per the exchange offer, the company proposed to exchange up to 100% of the bonds for an equal amount of new 11.50% second lien notes due 2025. As added incentive to participate, those electing to exchange would be permitted to purchase their pro rata portion of $50 million of newly issued 10% 1.5 Lien secured notes due 2024, of which much of the proceeds would be used to retire participating parties’ old notes at par. In the resulting transaction, bondholders exchanged 91.76% of the old notes. This turned out to be a win-win for all parties. Holders who exchanged the old 7.25% note, received a new bond with a higher coupon and good collateral as well the opportunity to participate in an attractive new-money bond. Holdouts that did not exchange their bonds saw the market price rise to 95 at September 30 and now have much greater confidence of repayment at maturity. The company avoided a bankruptcy that likely would have been costly, time-consuming and highly detrimental to all parties. In 3Q20, the CrossingBridge Low Duration High Yield Fund purchased the old 7.25% bonds and the 10% 1.5 Lien secured notes. At quarter-end, the 10% bonds had a 7.5% yield-to-worst and the 11.5% bonds had a 14.5% yield-to-worst.
MPC Container Ships (MPCCME)23 - As discussed in our 1Q20 commentary, investments in bonds of shipping companies were among the largest contributors to negative performance in that quarter. We noted, however, that we were confident that these were likely to be temporary, marked-to-market losses rather than permanent impairments. This proved to be so in the case of MPC Container Ships, whose bonds we have held since 2018. Norwegian company MPC Container Ships is one of the largest owners of container vessels in the world. Anticipating a covenant breach resulting from a decline in operating performance related to coronavirus lockdowns, the company was proactive and proposed amendments to bondholders providing temporary relief. We viewed the proposal as offensive and too “shareholder-friendly,” compelling us to take an activist role. We rallied bondholders and countered with a “new money” proposal. This forced the company to pursue a secondary equity offering to bolster the balance sheet and improve bondholders’ collateral coverage. In addition, the bond’s interest rate was increased by 150 basis points and the redemption price was increased to 104. In return, the bondholders loosened the covenants and extended the bond’s maturity to March of 2023. At September 30, the bonds had rebounded to 91. We remain comfortable with the position as loan-to-value is estimated at approximately 69% and the company recently reported a 21.5% increase in fleet-weighted charter rates.
Excitedly looking below the surface,

David K. Sherman and the CrossingBridge team
1 In a clinical context, a situation in which a large percentage of a problem is subclinical, unreported or otherwise hidden from view such that only the “tip of the iceberg” is apparent.
2 Baker, Bloom & Davis’ US Economic Policy Uncertainty Composite Index, ICE Data Indices, Bloomberg
3 For reference, China reported that 3Q20 gross domestic product grew 4.9% year over year.
4 “Tail risk” is portfolio risk that arises when the probability of change in value greater than three standard deviations from the mean is greater than that implied by a normal distribution.
5 Federal Reserve, ICE Data Indices, Bloomberg
6 Federal Reserve - Periodic Report: Update on Outstanding Lending Facilities, March 31, 2202 through October 7, 2020 https://www.federalreserve.gov/monetarypolicy/smccf.htm
7 As of June 30, 2020, the SMCCF owned 1.02% of the iShares iBoxx High Yield Corporate bond ETF (HYG), 4.35% of the SPDR Bloomberg Barclays High Yield Bond ETF (JNK) and 4.15% of the iShares iBoxx Investment Grade Corporate Bond ETF (LQD).
8 Bloomberg, Federal Reserve - Periodic Report: Update on Outstanding Lending Facilities, March 31, 2202 through October 7, 2020 https://www.federalreserve.gov/monetarypolicy/smccf.htm
9 Prior to the March 23, 2020 announcement of the SMCCF, the average credit spread for the ICE BofA US Corporate Bond Index (C0A0), an index of U.S. investment grade bonds, was over 400 basis points. At the end of June, the spread had narrowed to 160 basis points. With the SMCCF curtailing its purchases, the credit spread for this index has widened modestly to 185 basis points as of the end of September.
10 The “Fed put” is a slang term for the belief that the U.S. Federal Reserve will rescue the economy by decreasing interest rates or taking other measures to mitigate a downdraft.
11 High Yield Credit Chartbook, Bank of America, October 1st, 2020
12 “Fallen angels” are investment grade bonds that have been downgraded to high yield.
13 Global Credit Trader: Liquidity has the Upper Hand on Downgrades (For Now), Goldman Sachs, October 1st, 2020
14 Federal Reserve Bank of St. Louis, Non-Financial Corporate Businesses: Debt Securities and Loans; Federal Reserve Bank of St. Louis, Non-Financial Corporate Business: Revenue from Sales of Goods and Services
15 Corporations in most industries found relatively easy access to the capital markets as a result of the Fed’s actions, however, companies in some industries, including retail and energy, were unable to raise needed capital and, in many cases, went into bankruptcy.
16 US Credit Strategy Chartbook, Deutsche Bank Research, September 30th, 2020
17 See our 2Q19 investor letter for discussion of “zombie” companies.
18 Global Credit Trader: Liquidity has the Upper Hand on Downgrades (for now), Goldman Sachs, October 1st, 2020
19 ICE Data Indices, Bloomberg, Federal Reserve - Senior Loan Officer Opinion Survey on Bank Lending Practices: Commercial and Industrial Loans to Large and Middle-Market Firms
20 Marty Fridson, noted high yield market historian and strategist, has developed the FridsonVision Fair Value Model to calculate a fair value for high yield credit spreads employing six variables: credit availability, capacity utilization, industrial production, high yield default rate, the 5-year Treasury rate and a variable reflecting ongoing quantitative easing. Highly influenced by the low level of capacity utilization as a result of the pandemic, the model suggests that the high yield credit spread, as of the end of August, should be 792 basis points higher or a spread just over 1,300 basis points. Fridson says of the wide difference between the actual level and the calculated fair value: “The explanation seems clear: By intervening on an unprecedented scale, the Federal Reserve is supporting high-yield bond prices at a level that otherwise would be unimaginable in a recession, with commercial bankers wary of extending credit to all but the safest business borrowers. In particular, the central bank’s announced willingness to buy corporate bonds, including some rated less than investment-grade, has emboldened investors to pay prices they would not dream of absent that extraordinary support.” (S&P Global Market Intelligence/LCD News, September 2 and September 22, 2020)
21 As of 6/30/2020, our position in Golden Nugget represented 0.00% of the CrossingBridge Low Duration High Yield Fund. As of 9/30/2020, our position in Golden Nugget represented 1.98% of the CrossingBridge Low Duration High Yield Fund.
22 As of 6/30/2020, our position in Martin Midstream Partners represented 0.00% of the CrossingBridge Low Duration High Yield Fund. As of 9/30/2020, our position in Martin Midstream Partners represented 1.29% of the CrossingBridge Low Duration High Yield Fund.
23 As of 6/30/2020, our position in MPC Container Ships represented 0.49% of the CrossingBridge Low Duration High Yield Fund. As of 9/30/2020, our position in MPC Container Ships represented 0.57% of the CrossingBridge Low Duration High Yield Fund.

