
Rooting for my hometown Philadelphia Phillies in the playoffs, I am reminded that “fat pitches” are rarely presented to batters.
![]()
Rooting for my hometown Philadelphia Phillies in the playoffs, I am reminded that “fat pitches” are rarely presented to batters. To avoid striking out, they are often forced to swing at “skinny pitches” just inside the strike zone. Unlike baseball players, investors looking for the fat pitch are not forced to swing and can safely hold cash until the right opportunity comes along. Unfortunately, investors are often overeager to spot and embrace a “fat pitch” when, in truth, there is often less than meets the eye. In our view, the key to investment success is avoiding strike outs and successfully hitting “singles” and “doubles”. Of course, who doesn’t like a fat pitch?
CrossingBridge & Affiliate Managed Funds vs
Short-Term Treasury Securities1
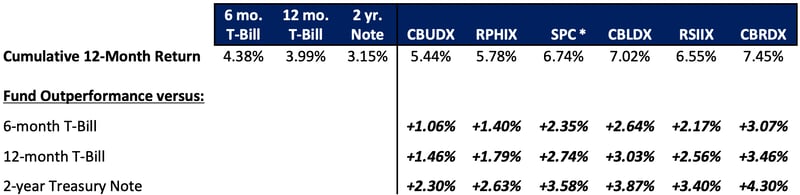
A link to each Fund’s standardized performance can be found in the endnotes. *The return for SPC (ETF) is reflected by its Market Price.
A year ago, many investors took the view that short-dated U.S. Treasuries were a “fat pitch”. On September 30, 2022, the 2-year Treasury bond was yielding 4.28% - “pretty good,” they thought, in comparison to the miniscule yields over the prior 15 years and “risk free”, backed by the U.S. Government. Although this perspective had some merit, it was not the fat pitch investors believed it to be. Rather, because rates had risen, it was simply a higher yielding place to hold cash while waiting for the fat pitch. It also had risks that investors did not consider. For example, as rates continued to rise, these securities experienced mark-to-market losses and investors were cut off from the ability to reinvest at higher yields during the holding period. Further, it ignored the risk posed by the disfunction of the U.S. Congress, crystalized when Fitch downgraded the U.S. sovereign credit rating2 and exemplified by the recent, unprecedented ouster of the Speaker of the House. In addition, an investor in Treasuries missed the opportunity to capture the risk premium in corporate securities. As shown above, our funds outperformed short-term Treasuries over the last twelve months, benefitting from active management and spread premium in the underlying investments.
Attractiveness of Asset Classes Across the Economic Cycle3
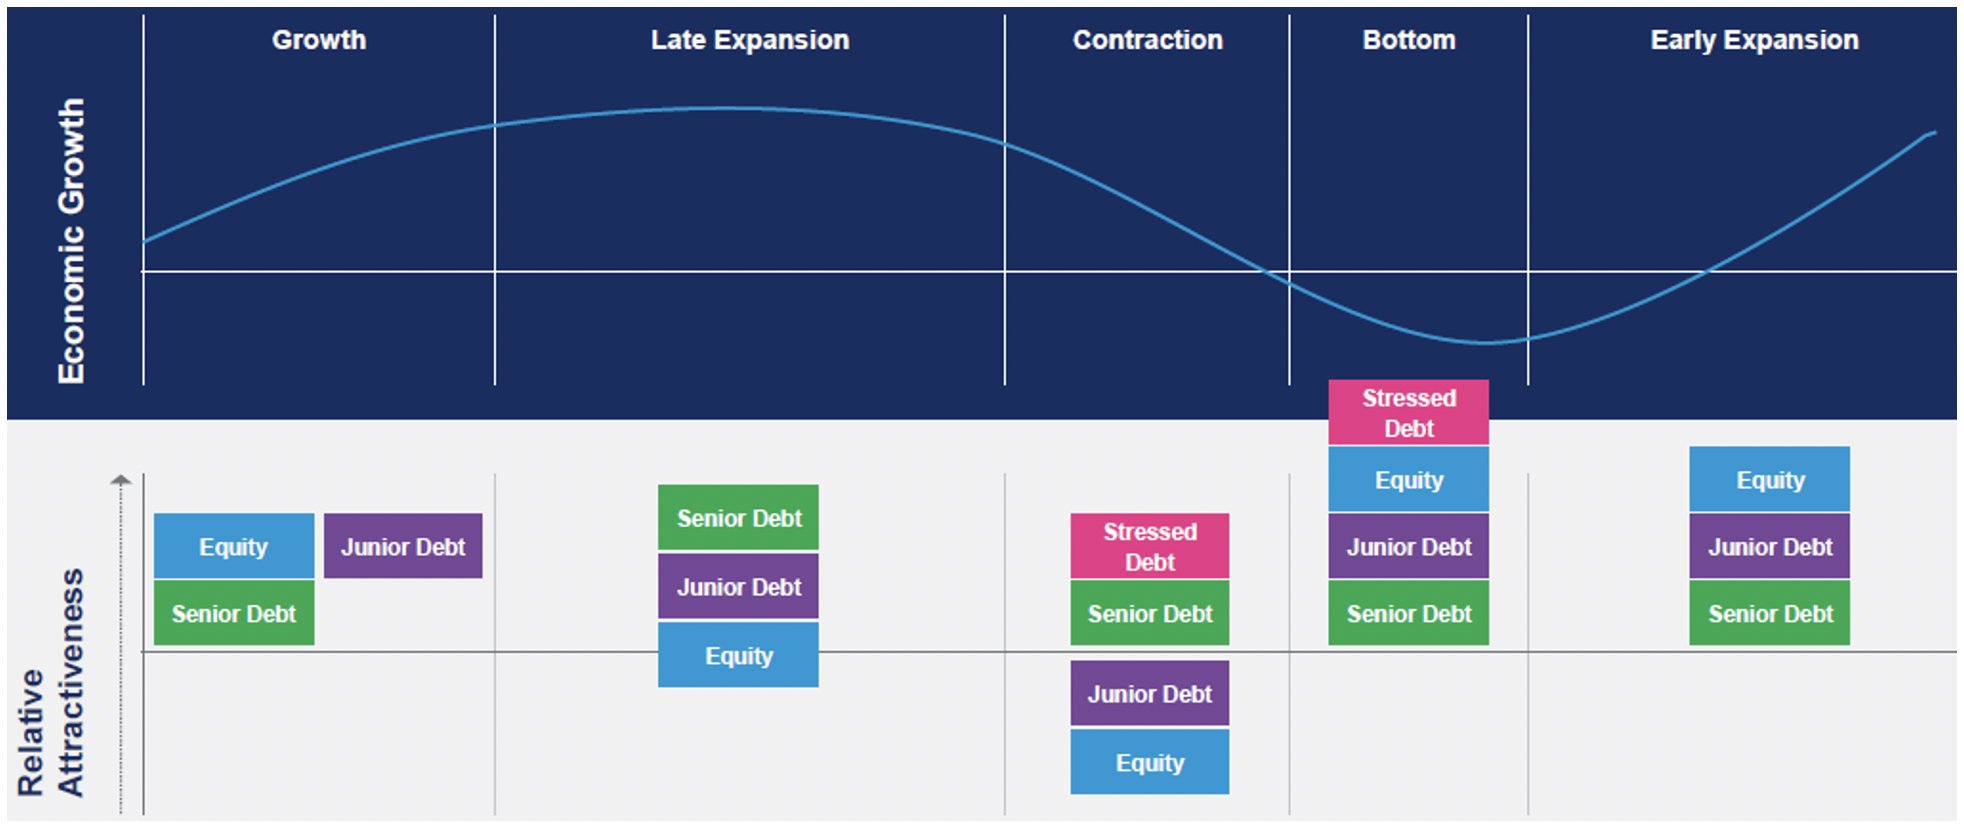
The diagram above, prepared by Mercer,4 reflects their view that different asset classes are more or less attractive depending on the stage of the economic cycle. An investor looking for “fat pitches” should keep this in mind.
Currently, a fat pitch being discussed is the upcoming opportunity for distressed investing. We have our doubts.5 Years ago, good companies with bad balance sheets presented fruitful opportunities. Today, most distressed candidates are more likely to be either venture-like businesses, running out of capital, or mature zombies, both of which have been described in previous letters. Although it may be tempting to allocate to the distressed market when the economy is bottoming out, the dramatic growth in funds raised that are dedicated to this asset class , combined with limited availability of high-quality opportunities has led distressed funds to practice “creditor-on-creditor warfare,” to compensate for sub-optimal returns.5 That said, we have the skill set to participate in a distressed fat pitch should we come across one.
In the spirit of hitting singles and doubles, senior debt appears to be the only asset class that consistently remains attractive throughout the economic cycle. This is where we live.
Energy Sector: Exploration & Production Companies and Midstream Service Providers
High Yield Energy Leverage and
Spread per Turn of Leverage6
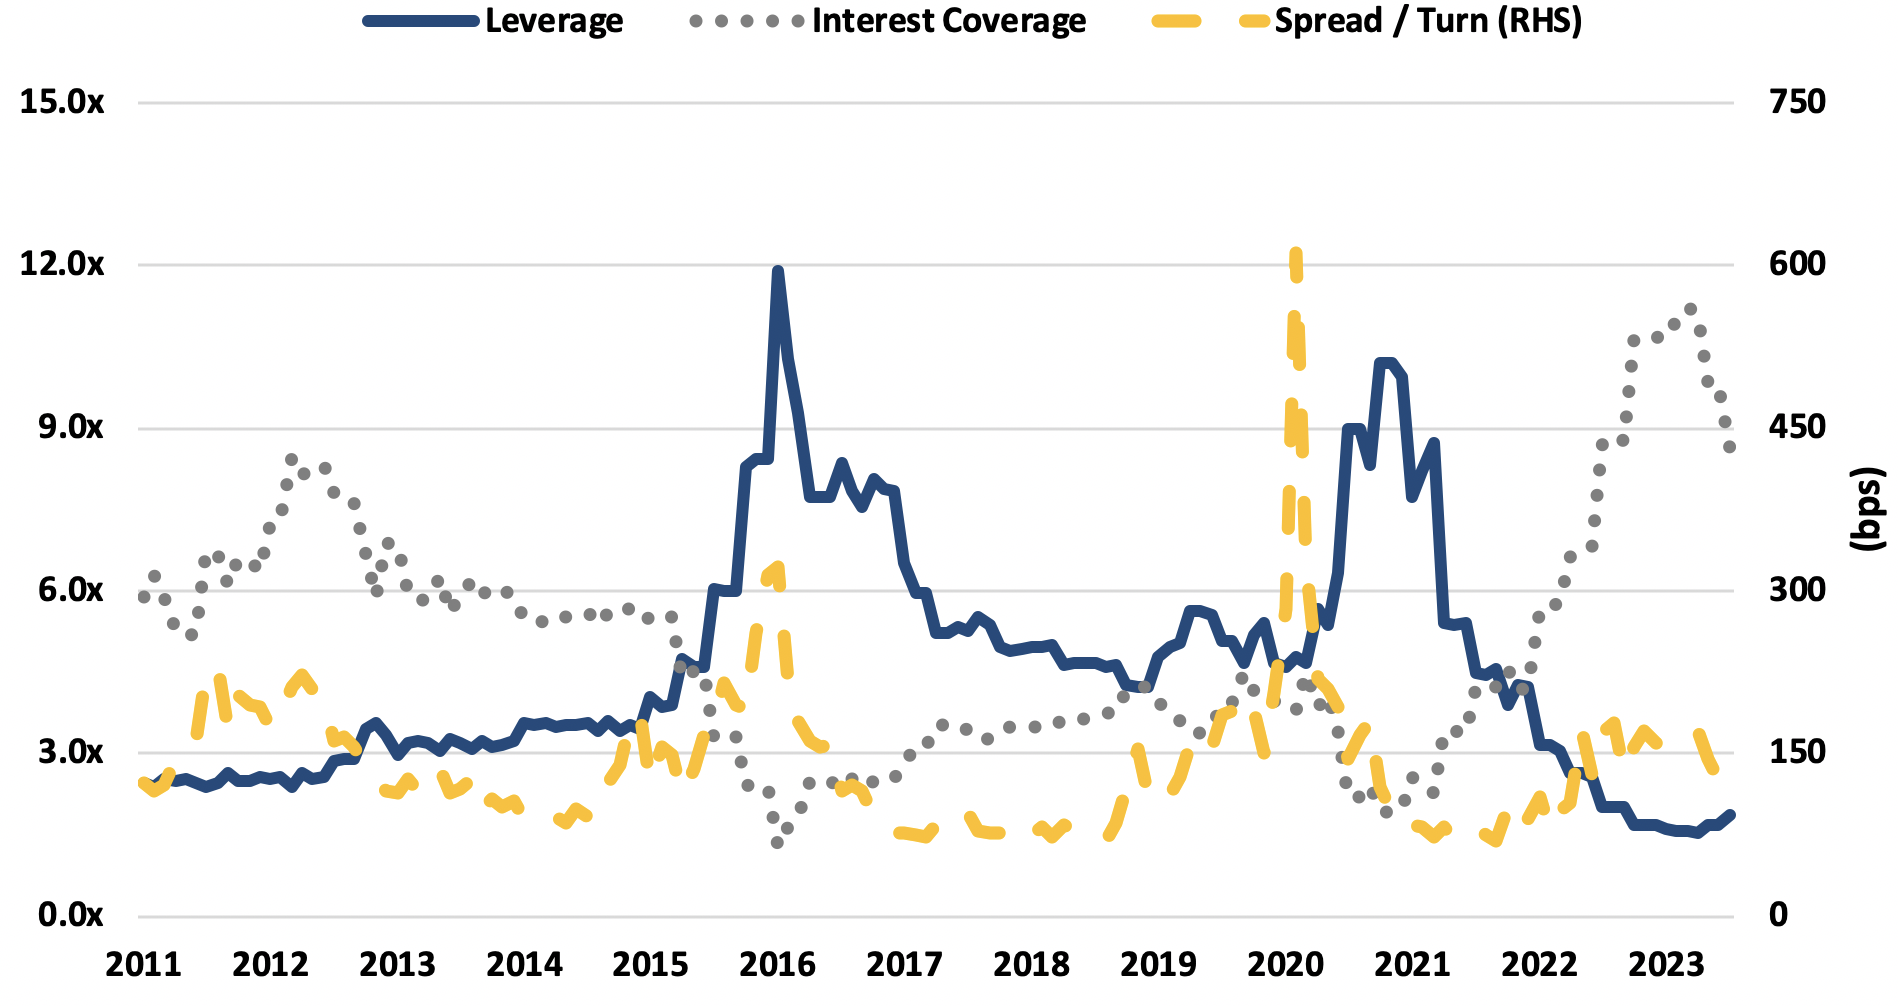
In June, I participated in a panel at a high yield conference sponsored by the CFA Society of New York. One of the speakers made the case that high yield exploration & production (“E&P”) credit was a “fat pitch” that should be overweighted. She argued that many of the companies had de-levered and that yields were attractive relative to other sectors in the high yield indices. Indeed, as shown above, leverage among high yield energy credits has declined from the peak in 2020-22 and interest coverage has dramatically improved due to lower interest expense and higher cash flow. However, as of August 31, 2023, the average option adjusted spread per turn of leverage, a measure of return relative to risk, was 117 basis points, below the long-term average of 140 basis points.7
Moreover, we have several concerns related to exploration and production credits as the energy sector may repeat a well-established cycle:
- Merger and acquisition activity is robust with capital chasing production and consolidation opportunities in response to rising energy prices. Risk is already rising. For example, in the Permian basin this year,8 nearly 44%9 of acquired reserves have consisted of more speculative proven, undeveloped (“PUD”) reserves, to which we, in our analysis, attribute little value. Furthermore, several recent transactions are being priced at modest premiums to proven developed reserves (“PDP”), leaving little or no safety margin.
- As valuations rise, companies pursue the cheapest form of capital. Recently, debt financing has become more prevalent as a primary source of capital. In fact, the energy sector is the highest dollar value issuer of junk bonds in 2023. With the futures curve for oil prices in “backwardation”10 the present value of reserves is likely inflated, suggesting that collateral support for debt may be lower than perceived.
- Eventually, commodity prices drop and/or operating execution disappoints, potentially leading to over-levered companies with depleting assets.
- Companies are forced to rationalize their balance sheets and focus on cash flow to survive – some don’t make it.
- Wash – rinse – repeat.
Although we have been a net seller of E&P credits in 2023 and presently have low exposure to the sector,11 there have been instances in which we find attractive investments in exploration & production (E&P). Often, the opportunities we find interesting are companies that are emerging from distress with low leverage and cleansed of value-impairing liabilities. These investments must meet high hurdles in terms of asset coverage, expected return and covenant protection. Today, most of our new debt investments in the E&P sector are event-driven, premised on a corporate event such as an asset sale or refinancing.
Midstream Loan-to-Value and
Spread per Turn of Leverage12
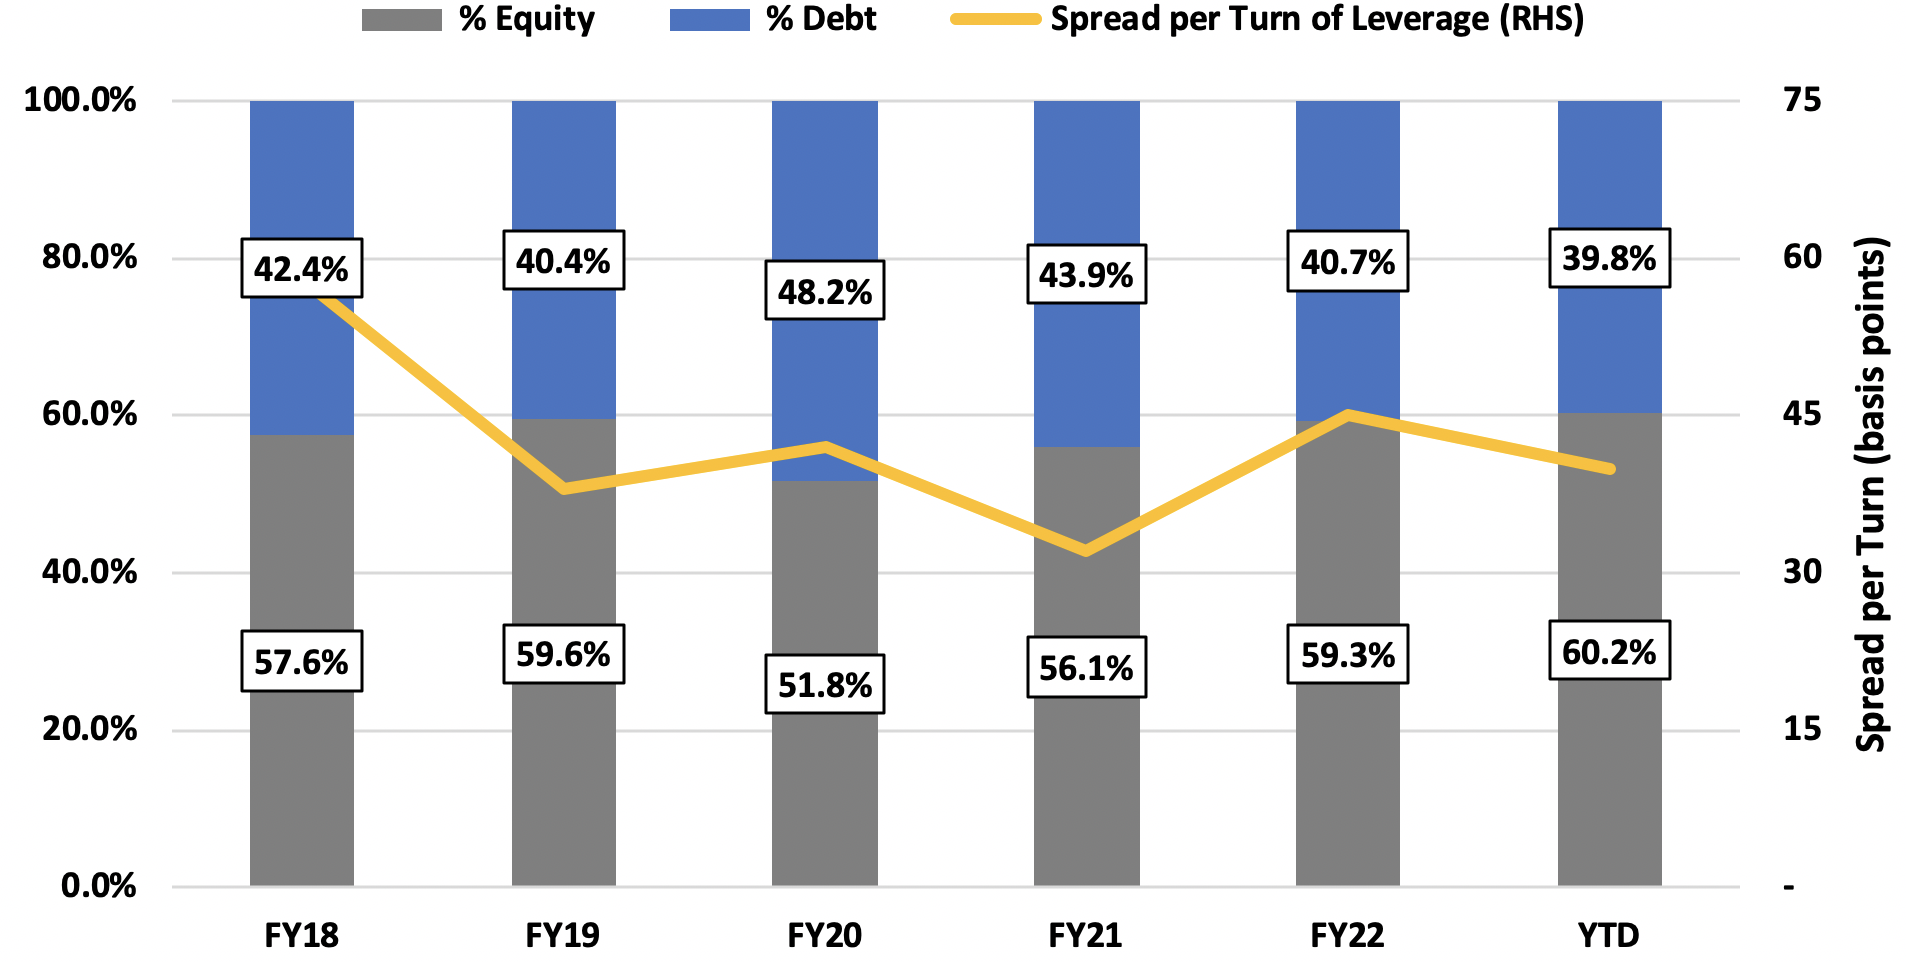
Another part of the energy sector, midstream service providers (“MSPs”) is also garnering attention from the wealth advisory community because, having learned the lessons of the past, these companies have been reducing leverage, increasing dividends, and repurchasing shares. MSPs, typically oil & gas pipelines, are often lumped together with energy producers yet have their own specific characteristics when it comes to credit. MSP assets may provide the only energy transport infrastructure available to an energy producer in a region, allowing good visibility of cash flow via long term contracts and minimum volume commitments. However, as these companies are often structured as master limited partnerships, they are required to distribute a large portion of net income to their equity holders, limiting their ability to pay down debt or reinvest for growth. Loan-to-value, a measure of credit risk, has improved modestly over the last five years but does not make the sector that much more attractive. Meanwhile, compensation for credit risk, as reflected in the credit spread per turn of leverage, is currently about average – thus, no great bargain. Moreover, these companies are increasing dividends and share buybacks enhancing shareholder value to the detriment of lenders.
We have invested in debt of MSPs selectively. For example, NGL Energy, which we will discuss below, has been prohibited from paying dividends since April 2019 when it issued its 7.50% secured bonds, due 2026. As a result, the company has been paying down debt since leverage peaked in 2021 and has vocally stated its intention to refinance all of its bonds in the near term, potentially creating an attractive event-driven opportunity.
Securitizations
Historical Spreads for the 5 Years Ended 3Q2313
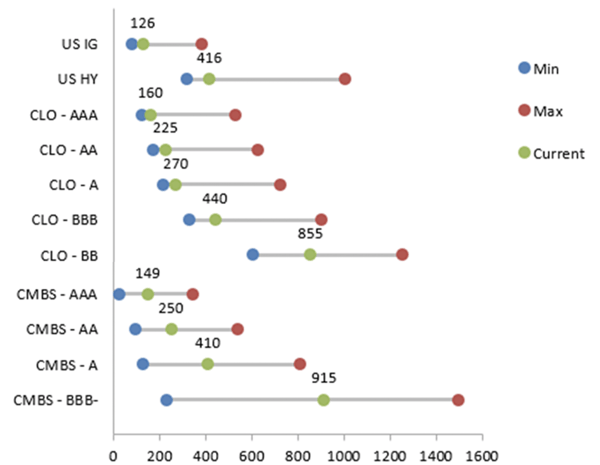
Following the scare brought on by the failure of Silicon Valley Bank and the near-death experience of First Republic Bank, spreads of asset-backed securities widened to attractive levels. As time has passed, spreads have narrowed. Still, BBB and below collateralized loan obligation (CLO) securities and AA and below commercial mortgage-backed securities (CMBS) appear cheap on a relative basis.
We continue to focus primarily on single-A CMBS securities that are not exposed to central business district properties. As we discussed in prior letters, we expect the commercial real estate market to take several years to heal and we hope, ultimately, to find a fat pitch or two in the future - but buyer beware.
Investors are also pointing to the lower tranches of CLOs that are providing high yields. This may be the case, but we do not invest in that market unless we see a fat pitch such as in 2009, when the economy was emerging from the Great Financial Crisis (“GFC”). Moreover, we typically do not invest in CLOs for the same reason that we shy away from financial institutions: they take underwriting risk, they take spread risk, they take counterparty risk, and they are dependent on the capital markets remaining fluid. These risks are similar to the risks we face every day. Therefore, we choose not to increase our exposure unnecessarily, particularly as these financial issuers also employ leverage. Investors attracted to the wide spreads for BBB tranches of CLOs should be aware that, typically, this tranche begins to experience principal losses when aggregate portfolio losses reach 16%. This is comparable to a real estate loan or a leveraged buyout (LBO) that has been financed at an 84% loan-to-value -- risky propositions in our estimation. “Live by the sword, die by the sword.”
Private Credit
Private Debt Return by Vintage Year14
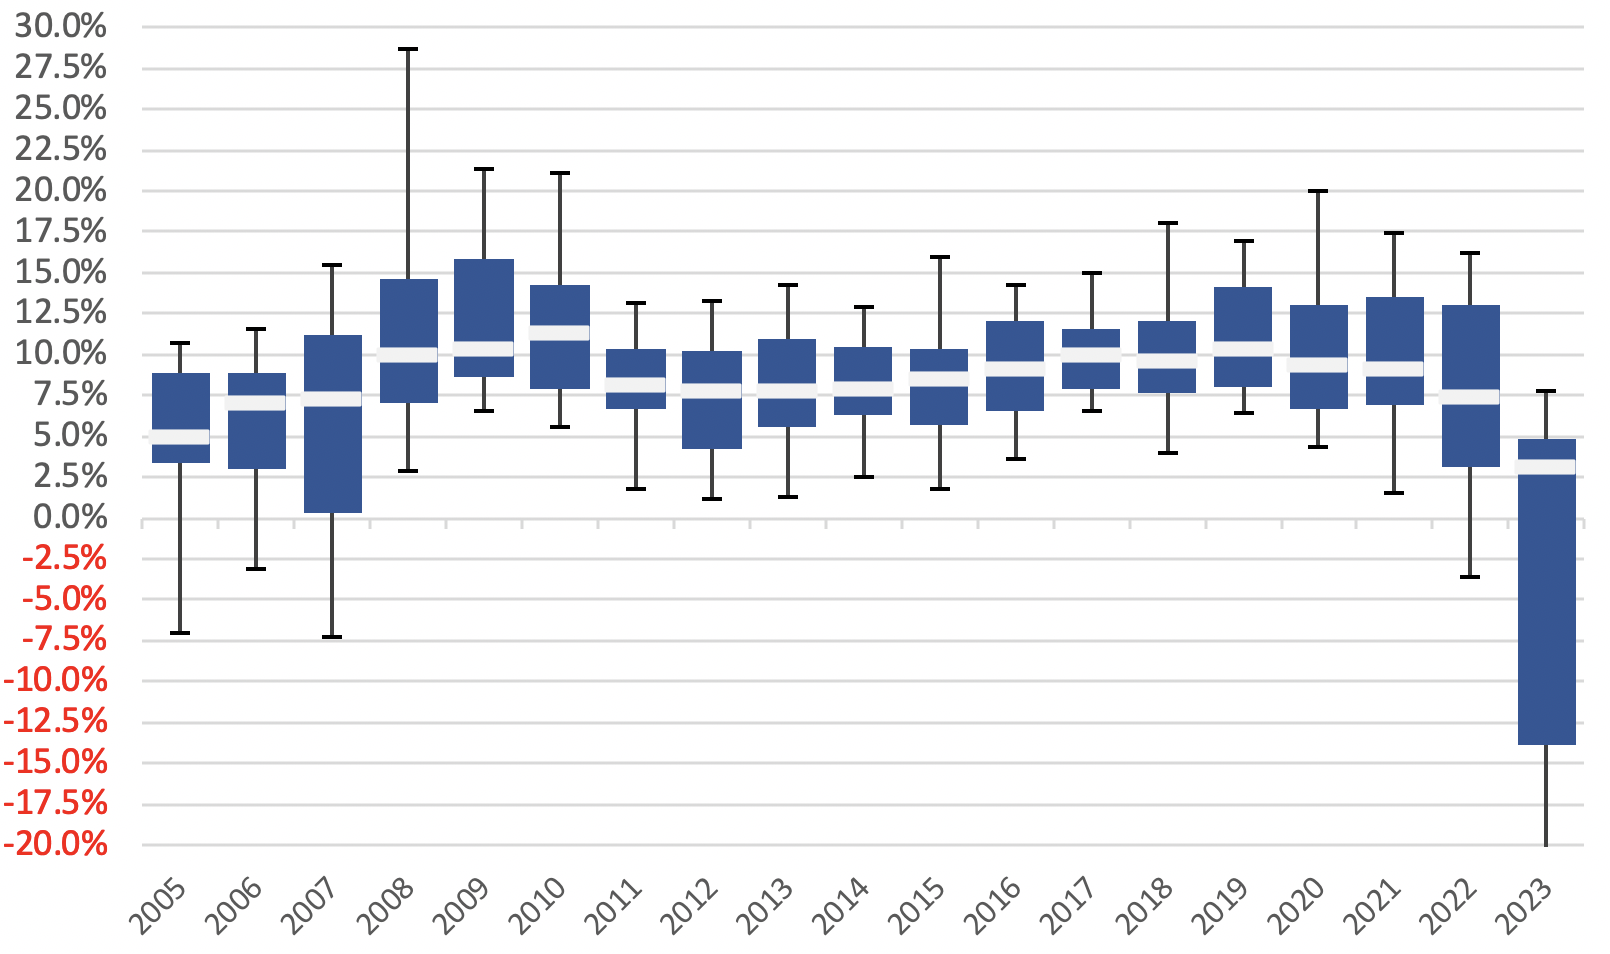
The graph above shows the performance of private debt issued by cohort year. It appears that private debt is not the “fat pitch” being widely touted. The median return for originations in each year since 2005 has been 8.8% with a wide range of performance. Clearly, manager selection is paramount.
The growth in “private credit” over the last few years has come about as private lenders have replaced banks, providing floating rate debt that affords borrowers the flexibility to repay early with little or no prepayment penalty and providing investors with interest rate protection. Thus, “private credit” is, supposedly the hot new thing providing higher returns with lower volatility, yet our head of research began his career in the 1980s in the private placement group of a large life insurer and sees nothing new. As was the case 30 years ago, private credit is typically:
- Provided by institutions other than banks.
- Issued by privately-owned borrowers who prefer a private transaction or, more likely, have no access to the public bond or bank loan markets due to their smaller size or complex credit story.
- Tailored to the borrower’s specific needs in terms of size, repayment schedule, covenants, etc.
- Backed by senior claims on issuers’ cash flow and/or assets.
These factors contribute to the belief that private credit provides higher returns. However, as with most investments, higher return comes with higher risks (selectively, but not all-inclusive):
A lower default rate does not mean there is less distress. Defaults are lower because, when faced with a potential default, it is easier to get a small group of lenders to agree to waive a covenant than to get 20-100 bondholders or a large syndicate of lenders to agree to a waiver. While there may be fewer “defaults”, the aggregate level of distress may be comparable to the leveraged loan market.
Volatility is low because there is no credible mark-to-market. Proponents of private credit often point to lower volatility relative to high yield and syndicated leveraged loans. However, this does not reflect greater safety in the private credit market; it is a direct result of the fact that these loans do not trade so there is no price discovery, potentially imparting a false sense of stability.
Minimal market liquidity means lenders must live with their mistakes. Given that each private debt issue may be held by one lender or a small group of lenders, it is much more difficult to sell a distressed private loan than a troubled bond or syndicated loan for which there are many holders and a well-established market for distressed debt. Thus, private lenders have limited ability to sell a loan to avoid anticipated losses. Moreover, in the absence of an ability to sell troubled credits, a private lender will need to develop an in-house workout capability to manage the distressed situations that are inevitable in any credit portfolio.
The private credit market has not experienced a default cycle. The private credit market has seen its greatest growth in the aftermath of the GFC when it began to fill the void left by banks that dramatically reduced their loan exposure in the face of new capital rules. The rise in defaults in 2014-16 was primarily concentrated in the energy industry and weakness in credit in 2020-21 resulting from the COVID-19 crisis was largely offset by government-funded stimulus. Thus, there has not yet been a broad default cycle since the GFC to test the safety and security attributed to the private credit market.
We continue to emphasize idiosyncratic investments with the discipline to re-evaluate and potentially sell (even if it means taking a loss) when, in our view, risk versus return goes askew – see FXI below. As mentioned earlier in this letter, we discuss a MSP investment – see NGL Energy below. Lastly, we provide a recent portfolio holding which was intended, in baseball parlance, to be a “single”, but turned out to be a “double” – see Georg Jensen.
FXI Holdings (FXIHLD) 12.25% Secured Notes due 11/15/2615 - The company, formerly known as Foamex, is a leading North American producer of foam solutions selling bedding, furniture and automotive foam via retail and wholesale channels. The company was acquired by private equity firm One Rock Partners, LLC in 2017. We have owned several of the company’s bonds at various times since 2018 and initially purchased the 12.25% Secured Notes, due 2026, in October 2019 when the bond was issued. We were attracted to the solid management, the benefits of rapid growth in the bedding industry, reasonable leverage below 5.0x EBITDA and free cash flow enabled by low capital expenditures. With the ability to pass through supply chain-related cost increases and benefitting from a rise in household formation during COVID which led to increased mattress sales, the company performed very well in 2021. However, they experienced a contraction in 2022 as demand for new bedding waned and new car production was constrained due to supply chain issues. In March 2023, ahead of its 2024 unsecured bond going current in November 2023, the company exchanged the majority of its 7.875% unsecured bonds for new 12.25% secured bonds due 2026. This exchange increased annual cash interest expense by approximately $20 mm, pressuring cash flow, and increasing the amount of debt that is pari passu with the bond we held prior to the exchange, weakening its position. Thus, given the declining trajectory of the business, rising leverage, weaker structural protection and the challenging $1.24 billion maturity wall that looms in late 2026, we concluded that the 16% yield to maturity was not enough compensation for the growing risk and sold the remainder of our position in 3Q23.
NGL Energy Partners LP (NGL) 6.125% Unsecured Notes due 3/1/25, 7.50% Senior Secured Notes due 2/1/26, Series B Preferred Stock16 - NGL Energy is a diversified midstream master limited partnership (MLP) that provides transportation, storage, marketing and other logistics services for crude oil, liquid hydrocarbons, and water generated as part of energy production. Experiencing a sharp decline in EBITDA during 2020, NGL repaid its asset-backed loan facility and bridge loan in January 2021 by issuing a 7.50% senior secured note due 2/1/26. Given elevated pro forma net leverage, bond purchasers required a covenant preventing the company from paying dividends until total leverage was reduced below 4.75x EBITDA. Thus, since that bond was issued in January 2021, the company has keenly focused on de-leveraging. “Walking the talk,” the company partially repurchased its 7.50% unsecured notes, due 11/1/23, during 1Q23, ultimately calling the remaining bonds, of which we were holders, at par on 3/31/23. Concurrent with our initial purchases of the unsecured bonds in January 2023, we began to purchase the 7.50% senior secured notes due 2/1/26. With conservative secured leverage and expectations for continued de-leveraging, we were comfortable purchasing these bonds at a weighted average price of 95.8, providing a yield to maturity averaging of 9.14% and the opportunity for a higher rate of return if the company followed through on its stated intention to repay this bond before it became a current liability on 2/1/25.17 To that end, management expressed its intention to repay the 6.125% unsecured bonds, due 3/1/25, no later than the end of March 2024. Still able to purchase the bonds at a discount, we added to the position in the 6.125% bonds in late August, and, in addition, have been actively trading the NGL Series B Preferred Stock. The preferred shares have been accruing their dividend at a rate that resets each quarter, currently 12.783%, and, as of quarter-end, are trading at nearly a 20% discount to their liquidation value which continues to increase with each dividend deferral. As the company is prohibited from making distributions to MLP unit holders until it has paid the preferred dividends that are in arrears and resumed the cash dividend to the preferred shareholders, we anticipate significant catch-up payments as early as late 2024 if the company succeeds in refinancing its capital structure. NGL is a good example of a series of attractive, well-grounded investments, that “advance the runner” without “swinging for the fences.”
Georg Jensen A/S (GEORGJ) Secured Floating Rate Note due 5/14/2518 - Georg Jensen is a globally recognized Danish design house, with a history spanning over 119 years. The company designs, manufactures, and distributes an extensive range of gold, silver, and diamond jewelry, watches, home décor, tableware, and hollowware. In February 2023, we participated in the issuance of the company’s secured floating rate notes due 5/14/25, purchasing the notes at par to yield 9.55% with proceeds used to repay the company’s secured floating rate note due 5/15/23, which we previously held. We sold a portion of the bonds in the 100.50-101.50 range to book small gains in the months following issuance. However, the bonds jumped to the 104.00-104.50 range following the 9/14/23 announcement that the company was being sold to Fiskars Group, the owner of several global home goods brands including Fiskars, Gerber, Iittala, Royal Copenhagen, Moomin Arabia, Waterford, and Wedgwood. With some uncertainty as to the timing to complete the sale and the specific disposition of the bonds as a result of this transaction, we took advantage of the sharply higher price to sell most of our remaining bonds within days of the sale announcement. The bonds will be redeemed at a price closer to 106 on October 26, but given the opportunity to realize a quick gain rather than risk the bonds falling back if the deal fell through, we were quite content to sell and look for another opportunity.
US Treasury Yield Curves19
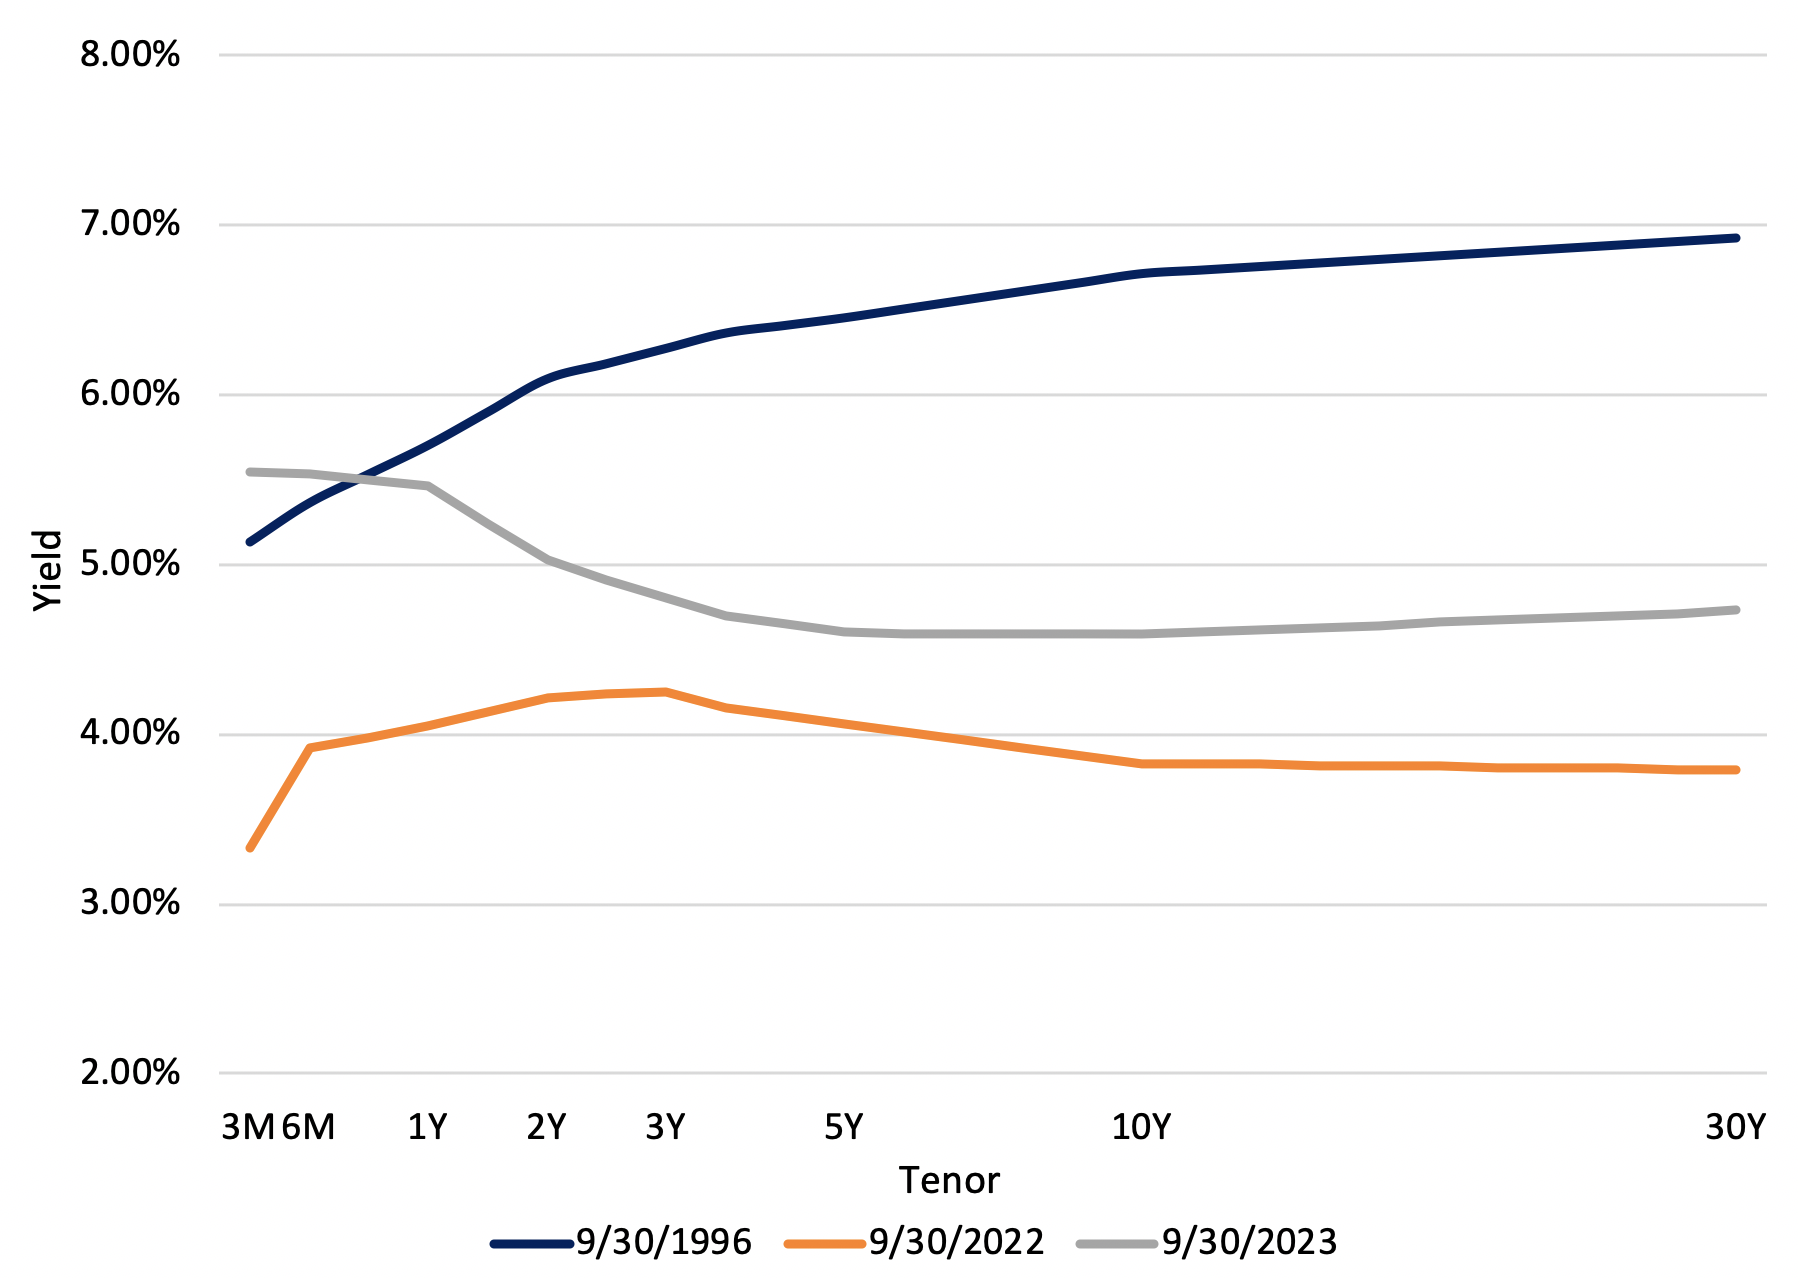
When I left Leucadia National in 1996 to “put out my own shingle” as an investment manager, short term interest rates were not that different from today’s levels. However, as shown above, the yield curve was “normal”, sloping upward, as opposed to the inverted curve we have today. Rates have risen dramatically over the last year, especially in the short end of the curve. Today’s inverted yield curve reflects an expectation by some that the economy will slow down and force the Federal Reserve’s hand to lower rates. Others are challenging this conventional wisdom with the belief that, structurally, the curve will normalize with medium and long-term rates going up; so far, they are right. Both sides, advocating getting long or shorting long duration bonds, believe that the setup is a fat pitch. Rather, we believe this is nothing more than interest rate speculation and, instead, will take a more agnostic approach. We prefer to accept risk in the form of corporate credit, taking advantage of high short-term rates and acceptable spreads to capture our returns.
The subject of the book and the movie, Moneyball,20 Billy Beane is former professional baseball player who was named general manager of the Oakland A’s in 1997. He is best known for crafting the team into a winner despite one of the lowest payrolls in the league by analyzing key statistical elements of overlooked, undervalued players rather than paying high salaries for stars. This approach is exemplified by a few lines from the movie21 in which Billy Beane is discussing a player prospect with John Poloni, an “old school” scout focused on players who can hit the fat pitch, and Peter Brand, the analyst who developed the mathematical tools employed by Beane:
(the scouts look at the report)
The Scouts: He gets on base.
Billy Beane: He gets on base!
John Poloni: So he walks a lot.
Billy Beane: He gets on base a lot. Do I care if it’s a walk or a hit?
(looks over at Peter)
Peter Brand: You do not.
Billy Beane: I do not.
Beane recognized that, in his system, the objective is to get on base regardless of whether it is by getting a hit or being walked. We think we are similar. We don’t think anything in our markets is easy or obvious. We expect to be successful by analyzing individual credit opportunities in a methodical, disciplined manner to determine whether they provide a respectable level of return that is commensurate with a responsible level of risk. Grinding out returns, this is the approach that permitted our portfolios to outperform Treasuries (and a lot of other portfolios) over the last year and, we believe, will serve our long-term investors well going forward.
Playing "small ball,"22

David K. Sherman and the CrossingBridge Team
Endnotes:
1 CBUDX is the symbol for CrossingBridge Ultra Short Duration Fund. RPHIX is the symbol for the RiverPark Short Term High Yield Fund, SPC is the symbol for the CrossingBridge Pre-Merger SPAC ETF. CBLDX is the symbol for the CrossingBridge Low Duration High Yield Fund. RSIIX is the symbol for the RiverPark Strategic Income Fund. CBRDX is the symbol for the CrossingBridge Responsible Credit Fund. Standardized performance can be found by clicking the link for each Fund. Standardized performance for the Treasuries can be found by clicking here. For further reference on the specific funds, please see https://www.crossingbridgefunds.com/ and https://www.riverparkfunds.com/index . Performance data quoted represents past performance; past performance does not guarantee future results. The investment return and principal value of an investment will fluctuate so that an investor's shares, when redeemed, may be worth more or less than their original cost. Current performance of the Fund may be lower or higher than the performance quoted.
2 On August 1, 2023, Fitch downgraded the U.S. sovereign credit rating from AAA to AA+, warning that “risks have risen that the debt limit will not be raised or suspended before the x-date and consequently that the government could begin to miss payments on some of its obligations." Standard & Poors effected a downgrade to the same level on August 5, 2011 following a previous debt ceiling crisis that took the country to the brink of default.
3 Private versus Liquid Credit, Mercer LLC, September 2023 (with permission)
4 Mercer is an employee benefits and investment consultant.
5 Note that most vehicles through which one may invest in distressed securities are private funds that charge high management and incentive fees, reducing returns to the investor. In addition, these funds will often have “lockup” periods, limiting liquidity.
6 For a primer on “creditor-on-creditor warfare”, read The Caesars Palace Coup by Sujeet Indap and Max Frumes.
7 Bank of America; data from February 28, 2011 through August 31, 2023
8 Located in western Texas and southeastern New Mexico, the Permian Basin is the highest producing oil field in the U.S.
9 Company filings and internal research
10 Commodity price curves are “normal” or in “contango” when prices are lowest in the near term and are expected to rise as time passes. Curves in “backwardation” are the opposite with prices high at present (“spot”) and expected to decline over time.
11 As of 9/30/23, exposure to the Exploration and Production sector was 1.68% in the CrossingBridge Low Duration High Yield Fund, 0.00% in the CrossingBridge Responsible Credit Fund, 3.61% in the CrossingBridge Ultra-Short Duration Fund, 4.37% in RiverPark Short Term High Yield Fund and 1.34% in the RiverPark Strategic Income Fund.
12 E&P and Midstream Relative Value Update, Barclays, September 19, 2023, and Midstream Monthly Outlook: October 2023, Wells Fargo, October 5, 2023
13 Bank of America – Reflects the range of credit spreads for each asset class over the five-year period ended September 29, 2023. Investment grade spreads reflect the credit spread for the ICE BofA US Corporate Index. High yield spreads reflect the credit spread for the ICE BofA US High Yield Corporate Index. CLO spreads reflect the market spread over the US Secured Overnight Financing Rate (SOFR) for 5-year floating rate tranches. CMBS spreads reflect the market spread over the Treasury rate for on-the-run fixed rate conduit structures (multi-asset, multi-sector) with a 3-year maturity for AAA tranches and a 10-year maturity for all other tranches
14 Pitchbook
15 As of 6/30/23, our position in FXI Holdings 12.25% Secured Notes due 11/15/26 represented 0.71% of the CrossingBridge Low Duration High Yield Fund and 0.69% of the RiverPark Strategic Income Fund. As of 9/30/23, our position in these bonds represented 0.00% of the CrossingBridge Low Duration High Yield Fund and the RiverPark Strategic Income Fund.
16 As of 6/30/23, our position in the NGL Energy 6.125% Senior Notes represented 0.00% of the CrossingBridge Ultra-Short Duration Fund and 0.00% of the RiverPark Short Term High Yield Fund. As of 9/30/23, our position in the NGL Energy 6.125% Senior Notes represented 2.44% of the CrossingBridge Ultra-Short Duration Fund and 2.57% of the RiverPark Short Term High Yield Fund. As of 6/30/23, our position in the NGL Energy 7.50% Senior Secured Notes represented 1.48% of the CrossingBridge Low Duration High Yield Fund and 1.58% of the RiverPark Strategic Income Fund. As of 9/30/23, our position in the NGL Energy 7.50% Senior Secured Notes represented 1.39% of the CrossingBridge Low Duration High Yield Fund and 1.14% of the RiverPark Strategic Income Fund. As of 6/30/23, our position in the NGL Energy Series B Preferred Stock represented 0.47% of the CrossingBridge Responsible Credit Fund and 0.46% of the RiverPark Strategic Income Fund. As of 9/30/23, our position in the NGL Energy Series B Preferred represented 0.44% of the CrossingBridge Responsible Credit Fund and 0.33% of the RiverPark Strategic Income Fund.
17 We made multiple purchases over several days at varying prices. Assuming a weighted average purchase date of 2/6/23 a weighted average purchase price of 95.8, the rate of return to a 2/1/25 repayment would be approximately 9.88%.
18 As of 6/30/23, our position in the Georg Jensen Secured Floating Rate Notes represented 1.13% of the CrossingBridge Low Duration High Yield Fund, 2.62% of the CrossingBridge Responsible Credit Fund and 1.10% of the CrossingBridge Ultra-Short Duration Fund. As of 9/30/23, our position in the Georg Jensen Secured Floating Rate Notes represented 0.11% of the CrossingBridge Low Duration High Yield Fund and 0.00% of the CrossingBridge Responsible Credit Fund and the CrossingBridge Ultra-Short Duration Fund,
19 Bloomberg
20 Moneyball: The Art of Winning an Unfair Game, Michael Lewis, 2003
21 This iconic scene can be revisited at the following: https://www.youtube.com/watch?v=3MjxoaynCmk&ab_channel=SceneCity
22 "Small ball” is an offensive strategy in baseball that emphasizes getting runners on base and advancing them to scoring position, 2nd or 3rd base, via singles, bases on balls, stolen bases, bunts, sacrifice flies, etc.