
 Quid nunc? is Latin for “what now?” The phrase made its way into English as “quidnunc,” a term for someone constantly…
Quid Nunc? (What Now?)
Quid nunc? is Latin for “what now?” The phrase made its way into English as “quid nunc,”1 a term for someone constantly asking for the latest news. Fittingly, many investors are forever asking “what now?” with each economic event, geopolitical development, or fluctuation in asset prices.
That is not how we invest. We are bottom-up, value-oriented analysts – not economic forecasters or market timers. Our job is to preserve capital while seeking attractive yields and spreads. Headlines matter only when they alter the value, risk, or expected return of an individual credit.
For several quarters, we have argued that investors are not being adequately compensated for liquidity risk or uncertainty. As we wrote in our 1Q26 letter, “Risk changes price. It does not disappear.”2 With high-yield spreads still hovering near the tightest decile of their historical range3, investors are getting little compensation for the associated tail risk.4 In this environment, returns must be earned one credit at a time.
And a good deal of that work happens after we buy.
Every investment starts with a thesis. New information arrives, prices move, and fundamentals change. Sometimes the thesis survives. Sometimes it does not. When it does not, the question becomes the one posed by our title: what now?
For a credit investor, the answer is rarely academic. There are generally three choices: sell, change seats in the capital structure, or buy more. Each requires a decision made with incomplete information, often when the market is least forgiving. The essential task is determining whether a decline in price reflects a mark-to-market event or the beginning of permanent impairment.
Ideally, our thesis would never be questioned, but that is not life. This quarter, we discuss three situations in which our thesis was challenged. In one, we sold to limit our losses. In another, we moved up the capital structure to mitigate losses and position ourselves to seek a higher total return. In a third, we bought a loan that other investors were dumping. We also closed the book on a restructuring that began nearly a decade ago, that illustrates value earns out over time if you are prepared to go through the bumps in the road.
Following these case studies, we briefly revisit several possible macro-outcomes using Gavekal’s Four Quadrants5 to frame what we are watching and how the funds are positioned. SPOILER ALERT: Gavekal identifies the current macro environment as an “inflationary boom.” Unfortunately, if things run too hot for too long, the cycle will change. We don’t know when the backdrop will shift, but we are on alert. Based on historical pattern recognition, the next cycle is likely to be an “inflationary bust” with a distant second choice, a “deflationary bust.”
Now What?
When a situation changes, we return to the four questions we6 teach our Global Value Investing students each fall at NYU Stern: Is it a good business? Is there a margin of safety? Is there alignment of interest? Is capital allocated appropriately? The answers rarely point in the same direction, and no single question decides every outcome. What matters most depends on what changed.
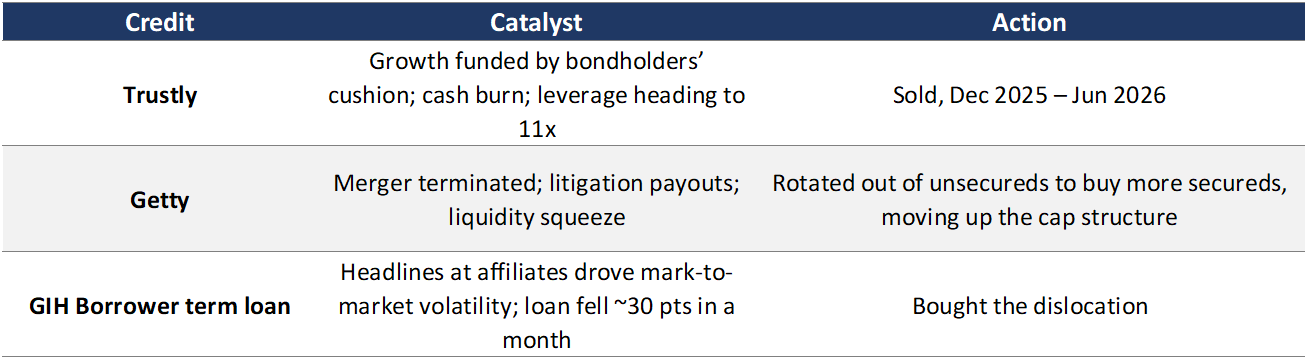
Trustly AB (TRSTLY) EURIBOR + 675 bps Secured Note due 20307
Trustly enables consumers in Europe and the U.S. to pay merchants directly from their bank accounts rather than using cards. In October 2025, Trustly issued in the Nordic bond market a €375 million five-year senior secured bond, which refinanced existing debt and was structured to leave approximately $72 million of cash on the balance sheet.
Pricing pressure and reduced activity from two large merchants had already affected earnings. However, we believed renegotiated agreements, cost savings, and growing payment volumes would stabilize cash flow and gradually reduce leverage, even if per-transaction fees declined. Our investment depended on the core underlying value of the platform, sticky user engagement, and barriers to entry while market growth would convert to growing cash flow, not simply more payments.
Is it a good business? We initially believed Trustly had durable competitive advantages anchored in its first-mover position. The company built an extensive network connecting 12,000+ banks and reaching ~42 million active users as of Q2 2025, offering merchants lower transaction costs and seamless checkout. We expected these established bank integrations and customer relationships to be difficult for new entrants to replicate, creating high barriers to entry, allowing Trustly to generate attractive incremental margins as transaction volume scaled over its fixed-cost platform.
However, the account-to-account (A2A) landscape has proven less sticky than we expected. Large payment aggregators, like Adyen and Stripe, offered integration with every major A2A provider, allowing merchants to easily switch from Trustly to a competitor. Consequently, large merchants could redirect volumes or negotiate lower fees, limiting how much value Trustly retained. Furthermore, Trustly’s U.S. product included payment guarantees, exposing it to losses when consumers’ payments failed. These characteristics made the economics less dependable than a simple payment processing model might suggest. A further risk was visible at issuance: JPMorgan began charging data aggregators for customer account access in 2025, and while Trustly described its own JPMorgan agreement as immaterial and other banks have not followed, it showed that U.S. banks can price or restrict the access Trustly’s model relies on. Continued growth demonstrated demand, but we became less confident that Trustly could convert that demand into durable cash profits.
Is there a margin of safety8? Our cushion depended primarily on the platform’s earnings power rather than tangible assets. Initial leverage9 of approximately 6.5x gross and 5.4x net already incorporated improvements from returning merchant volumes and cost reductions. We expected those improvements and further growth to make the debt progressively safer. Instead, continued pricing pressure and slower merchant recovery left the credit more dependent on future earnings than we had anticipated.
At first quarter 2026 earnings levels, annualized cash generation after capital spending, taxes, and leases covered only about half the interest bill. The secured position did not solve that shortfall. Even if the platform retained substantial value, we were becoming less comfortable relying on an earnings recovery or additional financing to protect our investment.
Is there alignment of interest? While the private equity sponsors had an incentive to build a valuable franchise, their strategy did not necessarily mean prioritizing debt repayment. Shareholders could benefit from accepting near-term losses to create a larger future business; lenders’ return depends on collecting interest and principal. We had expected growth and deleveraging to occur together.
In August, after our exit, management confirmed its active strategy to prioritize growth over near-term profitability to maximize future earnings potential. Their willingness to sacrifice current cash flow, already evident in price concessions before we sold, left us misaligned on how much risk the balance sheet should absorb. Our concern was not whether the owners wanted Trustly to succeed, but whether their chosen path would adequately protect existing lenders.
Is capital allocated appropriately? We supported investment in products and customers but needed confidence that the cash returns would justify the spending. Software development remained a real cash requirement, while lower merchant pricing was an economic cost of winning or retaining business. As cash generation fell short, we preferred greater restraint rather than extending the period before growth became self-funding.
Second quarter results, released after our exit, validated our concern. Management widened U.S. payment approvals to attract users, accepting higher losses. Across the group, losses and other costs of sales increased by SEK 91 million against only SEK 37 million in additional revenue. Newly acquired customers might eventually become profitable, but the immediate cash cost was clear while the eventual payback remained uncertain.
Further, we also tracked unconventional sources, including consumer posts on X and Trustpilot reviews, which showed an accelerating pattern of user complaints about debited funds not reaching merchants, slow refunds, and collection of returned-payment fees, an early signal that the product experience and U.S. risk controls were under strain.
We began selling in December 2025 and fully exited in June 2026 resulting in an estimated weighted average total loss of 14.7%; clearly a poor and disappointing outcome. By the end of September, after Trustly announced it would cut about a quarter of its staff, the bond had fallen to 65.50.
Post script, in October, Nordic Capital and Alfvén & Didrikson committed more than $40 million of equity to the parent company to accelerate AI-driven product development, with closing expected in November, and the bond recovered to 77.50. The commitment showed meaningful shareholder support, but not evidence that the business could fund its strategy and debt service internally. In hindsight, our margin of safety rested on the moat: a platform that is hard and expensive to build, sticky customer relationships, adequate cash to support the business, and debt that was modest relative to the franchise’s value. We exited as our thesis was challenged: aggregators and large merchants eroded that stickiness, complaints about the product grew, and equity/lenders became misaligned as the owners’ prioritized growth over protecting lenders.
Getty Images Holdings (ABEGET) 11.25% Senior Secured Notes due 2030 and 14.00% Senior Unsecured Notes due 202810
Getty Images licenses photography, video, and other visual content. Its Creative business supplies stock imagery for commercial use, while Editorial provides news, sports, and entertainment coverage alongside a valuable historical archive. We have owned Getty debt for years, attracted to its cash generation and nearly $500 million in debt paydown since 2021. In February 2025, we participated in the new secured issue for its attractive pricing and covenants, while continuing to hold the company’s 9.75% notes due 2027.
The proposed Shutterstock merger offered a further opportunity to accelerate deleveraging. While it was pending, we exchanged our 9.75% unsecured notes at par into 14% notes due 2028, with a special par redemption tied to the merger and $30 million semi-annual principal payments. Getty terminated the transaction in July after UK regulators required Shutterstock to divest its own editorial business. Meanwhile, adverse rulings in lawsuits brought by former warrant holders and merger expenses were straining liquidity.
Our confidence in the operating business remained intact, but we increasingly expected a restructuring. However, our analysis of the company’s business alongside potential “game theory” of a restructuring led us to “change seats”.
Is it a good business? Established customer relationships, subscription revenue, and an extensive library supports recurring cash generation. We view AI concerns as overstated and largely confined to Creative, where customers also pay for licensing rights and protection against unauthorized use. Editorial remained a growing business built around authentic coverage of real events, exclusive access, and valuable owned archives. Those characteristics support our confidence in Getty even as AI increases competition in stock imagery.
Is there a margin of safety? By July, Getty had roughly $1.2 billion of first lien debt and $1.5 billion of total debt, representing 3.8x and 4.7x Debt/EBITDA, respectively. We believed enterprise value likely covered the debt through the 14% unsecured notes at par. In that narrow sense, they appeared “money good11.” But enterprise value alone did not determine what we would receive in a restructuring.
The secured notes’ first lien claims and covenants supported our expectation of full recovery across a range of outcomes. Unsecured claims were more exposed to the process, including the valuation adopted, new capital requirements, and the negotiating leverage of other stakeholders. While we would remain constructive on Getty overall, we would not be comfortable owning every part of its capital structure.
Is there alignment of interest? The Getty family and Koch Development own more than 70% of the equity. We expected them to seek to preserve ownership, potentially through a new capital injection, rather than financing a par repayment of the unsecured bonds. Secured lenders, meanwhile, had an incentive to reduce leverage. Neither objective required protecting unsecured creditors, leaving them exposed to substantial impairment either under a secured lender-led plan or a shareholder-backed recapitalization.
Multi-Color’s bankruptcy offered a relevant warning: a sponsor could reinvest to preserve ownership without protecting existing unsecured creditors. We needed to assess what each stakeholder wanted and how competing proposals would affect our recovery. That analysis favored participating as secured creditors rather than depending on shareholders or senior lenders to protect our unsecured position.
Is capital allocated appropriately? Getty’s early debt reduction had been creditor friendly, but obligations outside the core business were overwhelming its cash generation. We estimate annual free cash flow, after interest, of approximately $70 million against $86 million of scheduled principal payments, including $60 million on the unsecured notes.
The Company’s second quarter filing reported just $82 million in liquidity against approximately $100 million of remaining warrant litigation reserves. We no longer believed Getty could meet these demands and address the unsecured notes ahead of the bank debt’s 2027 springing maturity without restructuring.
We sold our 14% notes in mid-July at 66.50 plus accrued interest, for all-in consideration of 72 cents, realizing a loss. We joined an ad hoc secured bondholder group and added to our secured position in the high 70s and low 80s. In late August, Getty announced it would use the grace period for its September 1 unsecured interest payments to preserve financial liquidity, and on September 30 this payment was made.
On October 12, Getty agreed to a consensual restructuring with the Getty family and Koch through a prepackaged Chapter 11 process. The shareholders would provide approximately $433 million of new capital before closing adjustments, including bankruptcy financing that converts into equity, while Koch would also convert its existing euro term loan holdings into equity.
Our secured notes would be exchanged dollar-for-dollar into new first lien bonds due April 2032, preserving our principal claim, with accrued interest paid in cash. The initial coupon would be 10.5%, subject to reductions as leverage declined. Unsecured noteholders would receive approximately 63 cents in cash upon emergence, bringing their total recovery to approximately 70 cents including the September interest payment.
The proposed terms are consistent with our assessment of stakeholder incentives and our decision to sell the unsecured bonds while increasing secured exposure. Including accrued interest, our July sale generated modestly better proceeds than the unsecured settlement and returned our capital three months before this agreement. Our additional secured purchases imply an estimated 16.3% yield to maturity on the exit bonds at the initial coupon. We believe that represents attractive compensation for owning a secured claim on a cash-generative business with lower leverage and substantial new shareholder capital, although completion of the restructuring remains ongoing.
GIH Borrower LLC (GUGGPA) SOFR + 250 bps Term Loan due 203112
GIH Borrower LLC is the borrowing entity for Guggenheim Investments, the privately held asset management business within Guggenheim Partners. Guggenheim Investments managed approximately $252 billion as of June 30, 2026, with a particular focus on fixed income. Our loan finances the asset management business, not Guggenheim Securities, the group’s investment bank.
In August, investigations into related party investments at Delaware Life and Clear Spring, insurers controlled by Guggenheim co-founder Mark Walter, brought greater scrutiny to the firm’s insurance relationships. Separate inquiries into accounting at Guggenheim Private Investments (GPI), its private credit business, added to the uncertainty. Guggenheim defended its accounting and said it was cooperating with regulators. Questions also extended to Sammons Financial Group, an independently owned insurance client whose parent holds a minority interest in Guggenheim.
The term loan fell nearly 30 points during August, from approximately par into the low 70s. We believed this presented an opportunity to “go fish”, much like our Compass Diversified investment discussed in our third quarter 2025 letter. In both cases, negative headlines prompted us to examine the value of businesses outside the immediate controversy.
Is it a good business? We think money management is fundamentally a good business. It requires little capital, growth does not require a proportionate increase in overhead, and earnings generally convert well into cash. These characteristics support high incremental margins and attractive returns on invested capital. Client assets and flows also provide reasonable visibility into management fees, particularly with longer-lived investment mandates. For CrossingBridge, this is the business of our business, and one we know how to analyze.
We focused on Guggenheim’s retail franchise, including mutual funds, closed end funds, and other investment products with publicly available asset and fee disclosures. We also reviewed Western Asset Management’s substantial outflows following improper trade allocation allegations. At Allianz Global Investors, fraud involved its Structured Alpha funds, while other U.S. investment businesses retained value through their transfer to Voya. These cases informed our allowance for outflows while reinforcing the importance of valuing businesses outside the immediate controversy.
Bloomberg subsequently reported approximately $2.4 billion of September outflows from several of Guggenheim’s largest mutual funds. Those figures were consistent with our daily monitoring of public fund disclosures, rather than an unexpected deterioration. We had anticipated outflows and incorporated a smaller asset base into our underwriting.
Is there a margin of safety? We believe the retail franchise alone largely supports the price we paid for the loan, even after allowing for client outflows. We value its reduced earnings at 8x EBITDA, informed by publicly traded managers such as AllianceBernstein and Franklin Templeton. We consider their fixed income businesses and established retail distribution relevant to the franchise we are underwriting.
We also see strategic value in Guggenheim’s established products and retail distribution capabilities. Janus Henderson’s 2026 “take private” was valued around 10x normalized 2025 EBITDA, while earlier acquisitions such as Morgan Stanley’s purchase of Eaton Vance reached approximately 12x. At those acquisition valuations, the retail franchise could cover close to or more than the loan’s full face amount, without requiring client assets to recover.
Neither valuation assigns any value to the remaining business, even after excluding the Sammons mandates and GPI. We believe our purchase price is largely supported by retail, with the remaining institutional franchise providing additional protection against further deterioration.
Is there alignment of interest? Walter holds a substantial economic interest in Guggenheim through TWG Global. We believe preserving that equity value and the ability to receive future distributions gives him a strong incentive to protect client relationships and insulate the franchise from problems elsewhere in his businesses. His interests are not identical to ours, and we do not assume he will contribute additional capital. Nevertheless, preserving Guggenheim’s earnings power should benefit both its owners and lenders.
Is capital allocated appropriately? Our answer is more qualified here. Limited capital expenditure requirements leave an asset manager with substantial cash available for discretionary uses. As lenders, we would prefer more of that cash be retained or directed toward debt repayment rather than shareholder distributions.
We initiated our position at a weighted average price of 73.30, a 13.9% yield to maturity. We expect continued headline risk and have allowed for further client withdrawals rather than assuming the controversy will have no effect. The outcome is not yet decided, but our fundamental work gave us the confidence to go fishing while others were cutting bait. This is the trade we keep dry powder13 for: providing liquidity when it is scarce, at a price that pays us for the uncertainty.
What Then? A Nine-Year Postscript
In August 2026, we sold the last of the equity received in the restructuring of Real Alloy14, an independent aluminum recycler whose bonds we first purchased in September 2016. We reduced our position in early 2017 as signs of deterioration emerged, but a sudden liquidity crisis precipitated its Chapter 11 filing that November before we could sell the remainder at an acceptable price. Although the original investment had not developed as expected, we believed the business had been hurt by extreme conditions in the metals market and operating problems that could be corrected. Remaining invested through a restructuring that substantially reduced debt offered a better prospective recovery than selling at distressed prices. The reorganized company subsequently weathered 2018 and 2019 operating volatility and benefited from supply-chain constraints during and after COVID.
The 2023 sale of Real Alloy’s European operations provided a substantial realization of value, with the proceeds used to repay debt and fund a large shareholder dividend. This included repayment of the LIBOR+10% second-lien term loan due in 2023, Improving performance supported three additional dividends, and we sold portions of our equity opportunistically along the way. By August 2026, with no indication that other shareholders intended to pursue a sale of the remaining business, we concluded that holding the residual equity indefinitely no longer fit our fixed-income strategies and sold the balance. The overall investment spanned nearly ten years, but debt repayments, dividends, and partial equity sales had returned capital well before our final exit. From the November 2017 bankruptcy filing through our final exit, the position generated an annualized return of nearly 10.5%, reflecting the value recovered through our continued involvement rather than the outcome of the original bond investment alone15. From the original purchase, over the entire life of the holding, the estimated annualized return was 5.6% for a 430 bps spread over the equivalent Treasury (on a standalone basis).
Quid Nunc for the Economy? The Four Quadrants
Charles Gave of Gavekal Research sorts the economy into four regimes using two questions.16 Is the economy growing? When the S&P 500 has outperformed oil over the prior seven years, he believes it is. Is it inflating? When gold has outperformed a constant-duration ten-year Treasury, he believes it is. The answers yield four quadrants: deflationary boom, inflationary boom, deflationary bust, and inflationary bust. His framework was built for equity portfolios, but each quadrant has a clear meaning for credit, and below we have mapped how we think about each one.
The Four Quadrants Through a Credit Lens17
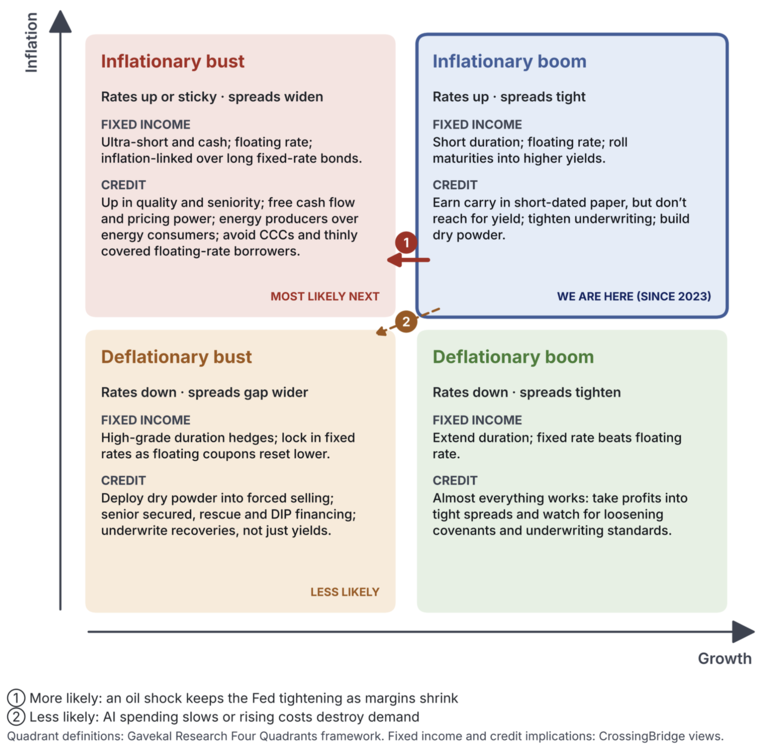
By Gave’s measure, the U.S. has been in an inflationary boom almost continuously since the start of 2023 and still is. That framework explains much of this year: rates rose, current income worked, duration did not, and markets largely shrugged off an energy shock that has pushed crude oil up more than 60% and diesel almost 90% year-to-date. History is less comforting about what comes next. Inflationary booms have usually ended in inflationary busts, typically triggered by a large rise in the price of oil. Every major equity bear market in Gave’s data occurred during an inflationary bust.18
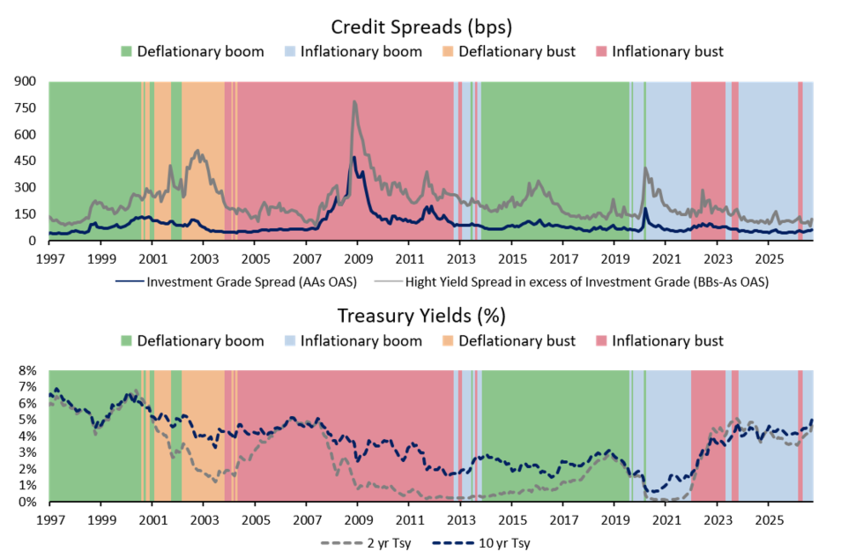
Source: Gavekal Research/Macrobond, Worse Than A Crime, September 23, 2026
For credit investors, the key distinction is whether weakness arrives through rates, spreads, or both. We see two exits from today’s quadrant, and neither is a soft landing for credit.
Exit one: an inflationary bust. The fuel is already on the fire. Crude oil is up more than 60% this year and diesel almost 90%. The Fed raised rates in September, and as of quarter-end, futures were pricing in three to four additional hikes by the end of 2027.19 Another oil shock would keep the Fed tightening just as higher energy costs squeeze corporate margins. For a bond investor, that is the worst combination: rates rise and spreads widen at the same time, so duration and credit both lose. The weakest borrowers are already feeling it, with CCC spreads wider by 272 bps so far this year. What tends to hold up is cash, very short maturities, senior secured claims, and borrowers that generate cash. Gave puts it bluntly: the market is “obsessed with investing in companies that are both massive energy consumers and have negative cash flows.”20 In credit, those are the AI infrastructure borrowers.
Exit two: a deflationary bust. The other path runs through interest rates. The ten-year Treasury yield has risen 111 bps this year, to 5.29%, its highest month-end level since March 2002. Higher rates are already doing their work outside of AI. Since the end of 2023, private construction spending outside data centers has fallen by about $89 billion, while data center spending has risen by about $61 billion (see the chart below).21 If higher borrowing costs, or disappointing returns, slow AI spending too, the economy would lose its main engine of growth, and growth and inflation could fall together. That would be good for Treasuries and painful for credit, and it is where dry powder earns its keep.
AI: The Swing Factor
Change in Private Construction Spending ($bn)22
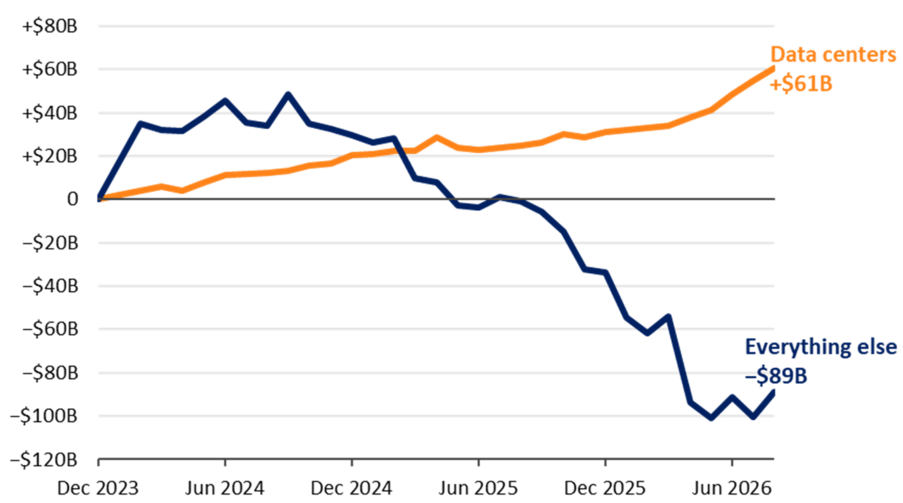
Which exit we take depends heavily on AI. As we discussed in our 2Q26 letter, the U.S. economy is all in: data center construction keeps climbing while all other private construction falls. Every major capex boom before this one (canals, railroads, electricity, telecom) ended in overbuilding and restructurings, even when the technology went on to change daily life. Gavekal notes that private capital raising for AI has been “arguably the biggest driver of higher bond yields this year.”23 In effect, the boom is raising its own cost of capital, and with it, the odds of Exit Two.
What We’re Watching
We do not know when the current inflationary boom will end, but we think the most likely next regime is an inflationary bust. A deflationary bust is the second path we are watching. (Of course, one regime can blend into a second regime).
The inflationary pressures are coming from more than one direction. Higher oil and fuel costs work through transportation, logistics, manufacturing, and ultimately end prices. The AI buildout competes for many of the same inputs used elsewhere in the economy, from semiconductors and electrical components to industrial equipment. Tariffs and the broader retreat from globalization add another layer of cost pressure. Taken together, these forces could keep inflation elevated even as they begin to weigh on corporate margins and demand—the path we think is most likely.
The second path is a deflationary bust. If the AI investment cycle slows sharply—or ultimately proves to have been overbuilt—one of the economy’s most important sources of incremental growth would weaken. The telecom cycle remains a useful analogy: the infrastructure can prove valuable while investors financing the buildout still earn poor returns. A deflationary bust could also emerge through demand destruction. Persistent cost increases from energy, AI-related demand for scarce inputs, and onshoring may eventually raise prices enough to constrain consumption and investment. In that case, the same forces contributing to inflation today could ultimately weaken growth bringing inflation down alongside.
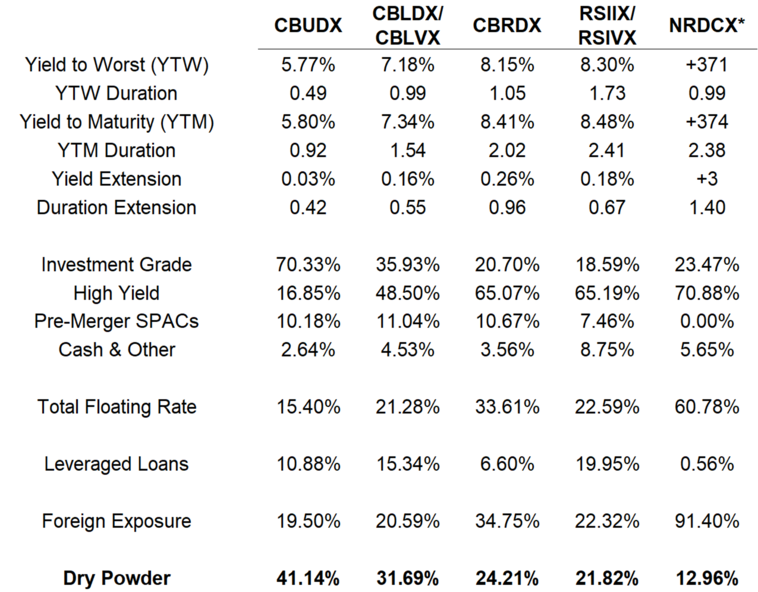
If inflation stays high, short duration, investment grade, and being senior in the capital structure can help protect capital. If growth breaks and spreads gap wider, dry powder allows us to deploy capital smartly; ideally buying from forced sellers. The positioning of the funds today reflects that framework.
Now What for Our Funds?
|
*NRDCX YTW/YTM: Spreads to Worst and Spreads to Maturity over benchmark rates listed, which is deemed a more appropriate measure with >80% of the portfolio invested in foreign domiciled bonds as well as multiple currencies (EUR 36.6%, NOK 33.1%, SEK 16.7%, USD 13.6% of invested portfolio). CrossingBridge defines ‘dry powder’ as cash, cash equivalents, pre-merger SPACs, and maturities of 90 days or less. |
Quidnunc?
Quidnunc is a busybody forever chasing the latest news and wanting to know what happens next. We are more interested in being prepared for it.
The discipline is not in continually asking, “What now?” It is in knowing when something has changed enough that the answer matters.
We cannot know what comes next. We can only seek to protect capital when the market does not compensate us for risk, and provide liquidity when others need it.
“Are We There Yet?”

David Sherman and the CrossingBridge Team
The Funds’ Subsidized/Unsubsidized SEC yields as of 9/30/26 were as follows:
CrossingBridge Low Duration High Income Fund (CBLDX): 5.56%/5.56%
CrossingBridge Low Duration High Income Fund (CBLVX): 5.30%/5.30%
CrossingBridge Ultra-Short Duration Fund (CBUDX): 3.84%/3.79%
CrossingBridge Responsible Credit Fund (CBRDX): 6.24%/5.93%
Nordic High Income Bond Fund (NRDCX): 8.21%/8.15%
RiverPark Strategic Income Fund (RSIIX): 7.23%/7.23%
RiverPark Strategic Income Fund (RSIVX): 6.98%/6.98%